

How Galileo combines geographic dashboards with detailed AIX and VIOS monitoring to identify infrastructure problems across multiple locations.
At IBM TechXchange 2026, infrastructure visibility was a recurring theme, particularly for organizations managing IBM Power systems across multiple locations. An AIX monitoring dashboard can help IT teams understand where problems are occurring, which systems are affected, and what needs attention.
Consider a failing Fibre Channel optic. The technical issue may be the same whether it occurs at a primary data center or a secondary site, but the operational implications can be very different.
Galileo brings geographic context to infrastructure monitoring through interactive dashboards that combine system health, active alerts, and location data.
The following example shows how that works across a distributed IBM Power environment, supported by detailed AIX and Virtual I/O Server (VIOS) monitoring.
AIX Monitoring Dashboard: Your IBM Power Environment at a Glance
This Galileo dashboard displays an IBM Power environment spanning New Zealand, from Auckland to Invercargill, on a single interactive map.
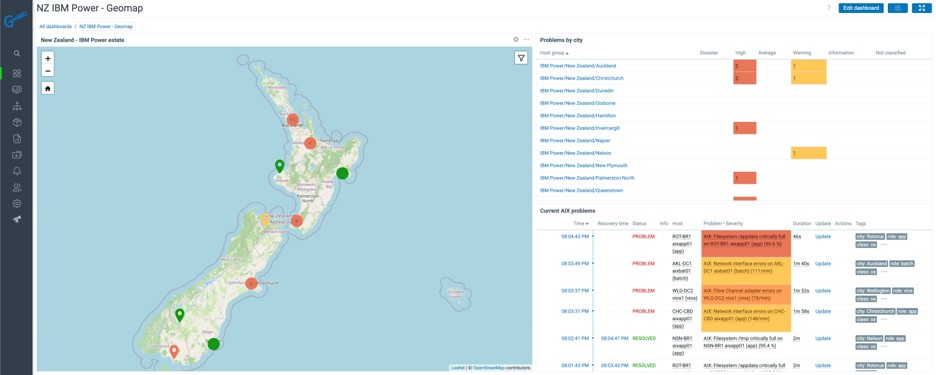
The dashboard combines three connected views:
- Live geographic map: Every AIX logical partition (LPAR) and VIOS is associated with its site's coordinates. Nearby systems are grouped into clusters, with markers colored by the most severe active problem. Red indicates high severity, amber indicates warnings, and green indicates healthy systems. In this example, Auckland, Christchurch, and Wellington need attention, while Taranaki, Hawke's Bay, and Dunedin show no active problems.
- Problems by city: A severity matrix shows open problems at each location, categorized as disaster, high, average, warning, or informational.
- Current AIX problems: A live problem list displays active issues, their duration, acknowledgment options, and tags identifying the city, system role (application, batch, or VIOS), and affected component.
Together, these views provide a geographic overview of infrastructure health and a direct path to investigating individual problems.
From Country to Individual System in a Few Clicks
The map is fully interactive. Zooming into a city separates clusters into individual sites. Selecting a marker displays the hosts at that location, along with their problem counts by severity.
Selecting a count in the city table reveals the corresponding problems within the dashboard.
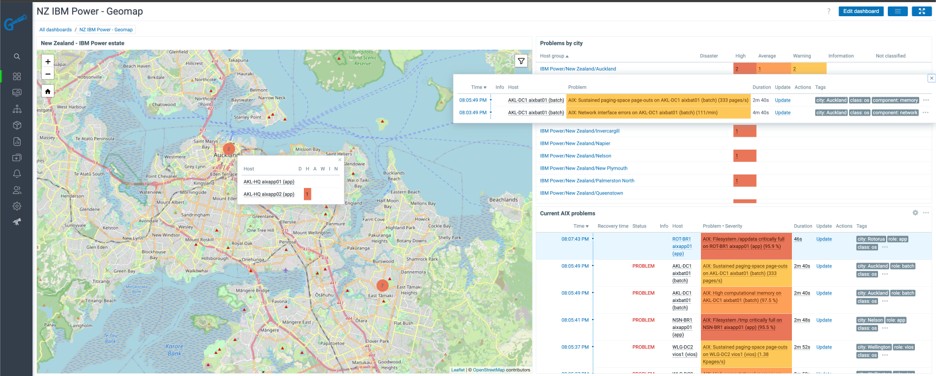
In this example, an operator moves from a red Auckland cluster to a specific batch LPAR at the AKL-DC1 data center. The system has sustained paging-space page-outs and network interface errors.
The same dashboard can support different operational needs. A network operations center can display regional health on a wall monitor, AIX administrators can investigate individual systems, and IT managers can identify affected locations.
Built from Existing Infrastructure Data
The AIX monitoring dashboard in Galileo uses host inventory and organizational data already maintained within Galileo.
Each host has latitude and longitude coordinates in its inventory record. Hosts are organized into groups by city and tagged according to their roles.
The map, city table, and problem list use those groups and tags to maintain consistent filtering.
When a new site is added, its hosts can be assigned the appropriate coordinates, groups, and tags. The dashboard then incorporates those systems into the geographic view.
Beyond Geographic Maps: Other Infrastructure Visualizations
Geographic maps are one of several visualization options available in Galileo. Teams can extend their AIX monitoring with dashboards tailored to their operational responsibilities and the information they need to track.
Available visualizations include:
- Geomaps: Location-aware views of distributed infrastructure.
- Network and topology maps: Diagrams showing systems, connections, dependencies, and their current status.
- Honeycombs: Color-coded cells that make it easier to identify unhealthy systems across hundreds of LPARs.
- Gauges, pie charts, and top-N tables: Views of capacity, utilization, and resource consumption.
- Graphs, problem lists, and severity matrices: Detailed monitoring information filtered by host group, tag, or severity.
- Service and SLA views: Infrastructure problems presented in the context of business-service health.
Dashboards can also be shared, displayed in rotation on operations center monitors, and scoped to specific teams or responsibilities.
What Powers the AIX Monitoring Dashboard?
A geographic map is useful only when the monitoring data behind it provides meaningful information.
Galileo's AIX monitoring capabilities extend beyond basic CPU, memory, and filesystem checks. Monitoring templates developed by Galileo's IBM Power specialists discover hardware and virtual devices, collect detailed operational metrics, and generate alerts for conditions that warrant investigation.
The following capabilities illustrate the depth of AIX and VIOS monitoring available within Galileo.
AIX Error Log Monitoring: Turning errpt into Actionable Alerts
The AIX error log is an important source of hardware and software health information. However, individual entries can be overlooked when administrators rely on periodic manual reviews.
Galileo monitors AIX error log entries and creates alerts based on unique error identifiers. Each alert provides information such as:
- Error type, including permanent, temporary, or informational
- Error class, such as hardware, software, or operator
- Error description and the resource that generated the entry
Administrators can configure severity levels by error identifier, determining which conditions should generate critical alerts, warnings, or no alert.
The monitoring configuration can also keep identified problems open until they are reviewed and closed, helping prevent transient hardware errors from being overlooked.
A companion summary template provides dashboard-level visibility into the error log backlog, including:
- Counts by error type and class
- Unacknowledged problems
- Age of the oldest open entry
- Most frequently occurring error identifiers
- Resources generating repeated errors
This helps administrators identify patterns that might otherwise remain buried in individual log entries.
Fibre Channel Monitoring: Detecting Optical Problems Early
Fibre Channel connectivity problems can develop gradually. A dirty connector, damaged cable, or aging small form-factor pluggable (SFP) transceiver may show signs of degradation before producing significant errors or link failures.
As part of its AIX and VIOS monitoring capabilities, Galileo tracks SFP health on physical Fibre Channel ports, typically through VIOS, where supported by the adapter and available diagnostics.
Key measurements include:
- SFP temperature: Alerts when an optic remains above its configured temperature threshold across consecutive samples.
- Supply voltage: Detects voltage readings outside expected operating ranges.
- Receive and transmit optical power: Tracks optical power levels in dBm, including low receive power that may indicate a cabling, connector, or transceiver issue.
Low receive optical power can provide an early indication of connectivity degradation before CRC errors or link interruptions become apparent.
The monitoring configuration suppresses related optical alerts while a link is down, reducing duplicate notifications caused by a single disconnection.
Additional Fibre Channel monitoring includes link failures, loss of synchronization, invalid CRCs, error and dumped frames, bandwidth utilization, link speed changes, and port type changes.
Configuration attributes such as num_cmd_elems and DMA settings are also recorded where available.
VIOS Shared Ethernet Adapter Monitoring
On IBM Power systems using virtualized networking, the Shared Ethernet Adapter (SEA) provides connectivity between client LPARs and external networks.
An SEA can involve several layers of physical and virtual networking components. Galileo discovers and monitors these components to help administrators identify the source of connectivity or performance problems.
Depending on the configuration, discovery includes:
- The SEA and its underlying physical adapter
- Virtual trunk adapters
- Control channel and backup adapters used for failover
- EtherChannel and link aggregation members, including primary adapters
Galileo collects operational status and performance information across these layers, including throughput, packet counts, errors, drops, speed, and bandwidth utilization.
Alerts identify conditions such as unavailable adapters, failed links, increasing error rates, and unexpected reductions in negotiated link speed.
These indicators can help administrators investigate problems involving physical cabling, switch ports, or virtual networking components.
Storage Path Monitoring and Disk Latency
Storage connectivity and performance problems can affect applications even when the underlying storage remains accessible.
Galileo's dashboard for monitoring AIX includes discovery of individual Multipath I/O (MPIO) paths, including their associated disks, parent adapters, and World Wide Port Names (WWPNs).
Alerts identify paths that are no longer enabled, helping administrators detect lost redundancy or connectivity problems.
Per-disk monitoring includes:
- Read and write service times
- Queue wait times
- Service queue full rates
- I/O timeouts and failures
Disk latency alerts also consider I/O rate and block size.
This additional context helps reduce unnecessary alerts caused by isolated slow operations on otherwise idle disks or large sequential transfers.
CPU, Memory, and Filesystem Monitoring
Galileo also provides detailed monitoring of AIX compute resources, memory utilization, and filesystem capacity.
Compute monitoring includes LPAR entitlement and entitlement utilization, physical CPU consumption, virtual processor utilization, shared processor pool capacity, and phantom interrupts.
Alerts can identify LPARs operating above their configured entitlement.
Memory monitoring tracks computational memory and paging-space utilization, helping administrators identify conditions that may affect workload performance.
Filesystem monitoring includes available capacity, inode utilization, and read-only filesystem detection.
Galileo can also estimate whether a filesystem is likely to reach capacity within the next 24 hours based on recent growth trends, giving administrators an opportunity to investigate before available space is exhausted.
AIX and VIOS Monitoring Coverage at a Glance
The following table summarizes the monitoring capabilities discussed above.
| Area | Monitoring highlights |
|---|---|
| Error logs | Per-identifier errpt alerts, configurable severities, error backlog summaries |
| Fibre Channel | SFP temperature, voltage, RX/TX optical power, link failures, CRC and synchronization errors |
| Networking | SEA and underlying adapters, link status, errors, drops, bandwidth, speed changes |
| Storage | Individual MPIO paths, WWPNs, service times, queue conditions, timeouts |
| Compute | CPU entitlement, physical CPU consumption, virtual processors, shared pools, phantom interrupts |
| Memory | Computational memory and paging-space utilization |
| Filesystems | Capacity, inode thresholds, read-only detection, 24-hour capacity prediction |
Table 1. Selected AIX and VIOS monitoring capabilities available in Galileo.
See Your IBM Power Environment in Context
An effective AIX monitoring dashboard helps IT teams connect individual infrastructure problems to the systems and locations they affect.
For organizations operating IBM Power systems across multiple data centers or geographic regions, that context can make troubleshooting and operational coordination more efficient.
Galileo combines detailed AIX and VIOS monitoring with geographic dashboards, infrastructure visualizations, and centralized alerting. It also provides visibility across other infrastructure technologies, helping teams monitor their broader environment from a unified platform.
Interested in seeing your infrastructure on a geographic dashboard?
Contact the Galileo team to discuss your environment and explore how location-aware monitoring could support your operations.