
Insights from IBM TechXchange 2026 on identifying problems, understanding performance, and keeping critical IBM i applications running.
IBM i troubleshooting was a recurring topic at the Galileo booth during IBM TechXchange™ 2026. We expected conversations about IBM® Power® servers, storage, and hybrid infrastructure, but what surprised us was how many visitors started with the same three words: "We run IBM i."
In fact, IBM i was the most frequently discussed platform at our booth. System administrators, developers, operators, and IT managers came looking for better ways to understand system performance, identify developing problems, and keep critical applications running.
Those conversations highlighted a familiar challenge: IBM i teams need to identify and troubleshoot problems quickly, often with fewer experienced administrators and more systems to manage.
In this article, I'll explain how Galileo helps teams address those challenges through historical performance data, automated analytics, and real-time alerting.
Why Effective IBM i Troubleshooting Matters
IBM i, the successor to the IBM AS/400®, remains a critical platform for organizations that depend on reliable transaction processing and business applications. Running on IBM Power servers, it integrates the operating system, IBM Db2® for i, security, and work management into a tightly integrated environment.
The platform continues to evolve. IBM introduced IBM i 7.6 in April 2025, followed by Power11® servers in July. Supported Power11 configurations can run IBM i 7.4, 7.5, and 7.6 with the appropriate updates.
Keeping these systems running reliably requires experienced administrators, effective troubleshooting practices, and the ability to identify problems before they disrupt operations.
According to Fortra's 2026 IBM i Marketplace Survey, which included 320 respondents, the leading concerns were:
| Concern | Respondents ranking it among their top five |
|---|---|
| IBM i skills | 69% |
| Cybersecurity | 64% |
| Application modernization | 62% |
| High availability and disaster recovery | 47% |
| AI, generative AI, and machine learning | 42% |
Table 1. Leading concerns among IBM i professionals, according to Fortra's 2026 IBM i Marketplace Survey.
For the first time, IBM i skills ranked as the leading concern.
Experienced administrators often recognize performance problems through years of familiarity with system behavior. As those individuals retire or take on broader responsibilities, organizations need ways to preserve operational knowledge and make performance information accessible to the rest of the team.
Historical monitoring, automated health checks, and consistent alerting practices help bridge that gap.
Three Layers of Visibility for IBM i Troubleshooting
Galileo provides three complementary capabilities for monitoring IBM i environments:
- Galileo Performance Explorer (GPE): Collects and retains detailed historical performance data from IBM i logical partitions (LPARs) through a lightweight native agent, supporting troubleshooting, trend analysis, and capacity planning.
- Galileo Analytics: Evaluates collected performance data against predefined health rules to identify conditions that warrant investigation.
- Galileo Active Monitor (GAM): Provides real-time monitoring and alerting for operational events, including QSYSOPR messages, hardware problems, job conditions, and selected security events.
Together, these capabilities help teams understand current system health, investigate historical performance, and identify conditions requiring attention.
Automated IBM i Performance Analysis with Galileo Analytics
When you're responsible for multiple IBM i partitions, identifying which systems need attention can take time. Galileo Analytics simplifies that process by evaluating performance data against established health rules and highlighting potential problems.
Its IBM i General report provides a consolidated view of system health, identifying critical and warning conditions alongside healthy LPARs and systems with collection issues.
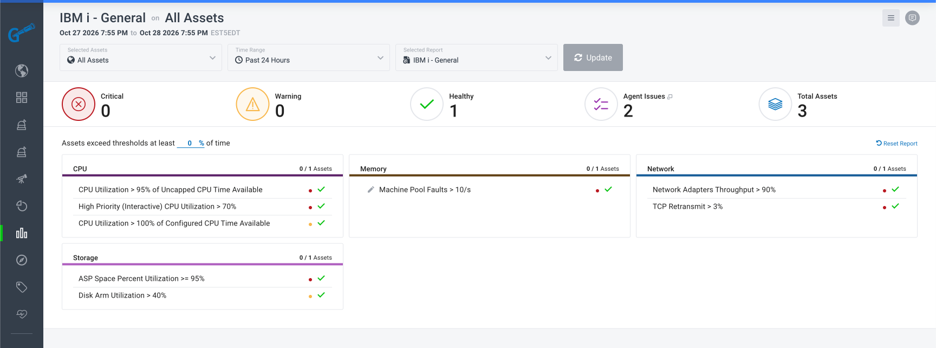
The report includes checks for common performance concerns:
| Area | Default health checks |
|---|---|
| CPU | CPU utilization above 95% of available uncapped CPU time; interactive CPU utilization above 70%; utilization above 100% of configured CPU time |
| Memory | Machine pool faults above 10 per second |
| Network | Network adapter throughput above 90%; TCP retransmits above 3% |
| Storage | ASP space utilization at or above 95%; disk arm utilization above 40% |
Table 2. Default health rules in Galileo's IBM i General analytics report.
Teams can adjust the percentage of time a condition must exceed its threshold before the report flags it. This helps distinguish brief workload spikes from sustained performance concerns.
For example, a short increase in CPU utilization during a scheduled batch process may require no action, while a partition operating near capacity throughout the afternoon deserves closer examination.
IBM i Performance Troubleshooting with Galileo Performance Explorer
When Analytics identifies a potential problem, or a user reports that an application was slow yesterday, Galileo Performance Explorer provides the historical data needed to investigate. Administrators can pinpoint when an issue occurred and examine the workloads and resources involved.
Each IBM i LPAR has a dashboard organized around the performance areas an experienced IBM i administrator would typically examine.
Configuration and System Context
Performance investigations often begin with understanding what changed.
Galileo displays partition configuration details, including operating system level, server model, processor features, entitlement, virtual processors, memory, storage pools, disk units, and network interfaces.
This information provides context when comparing performance before and after a hardware change, configuration adjustment, or workload migration.

CPU Performance: From Partition to Individual Job
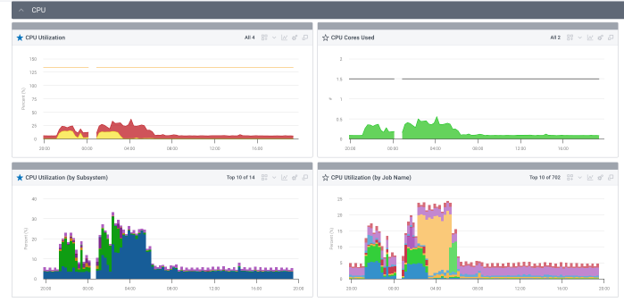
CPU-related issues are a common part of IBM i troubleshooting. Partition-level utilization is useful, but identifying the workload responsible for a spike requires additional detail.
Galileo tracks CPU consumption relative to entitlement and virtual processors, helping administrators evaluate available processing capacity and uncapped utilization.
It also breaks CPU activity down by subsystem, job name, library, user, and current user.
An observation such as "CPU was high at 3 a.m." can become a more useful finding: a particular batch job running under a specific user profile consumed most of the CPU between 2:30 and 5:30 a.m.
Memory and Storage Pool Performance
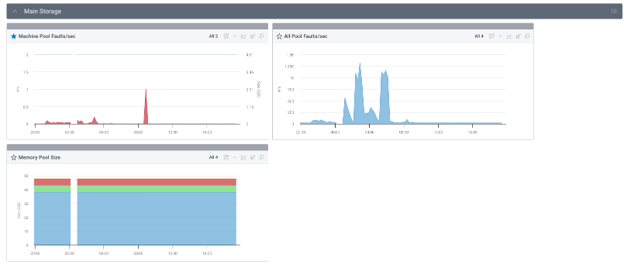
IBM i memory performance is closely tied to paging behavior.
Galileo charts machine pool faults, faults across storage pools, and individual pool sizes over time. These measurements help administrators determine whether paging activity reflects a temporary workload change or a memory pool that may require adjustment.
Auxiliary Storage Pools and Disk Performance
Storage is another important area of IBM i troubleshooting, since disk performance problems can affect applications even when overall system utilization appears normal.
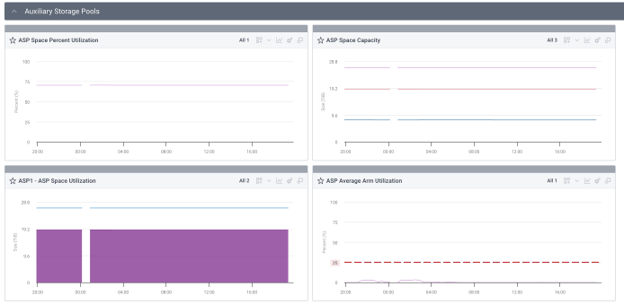
Galileo tracks auxiliary storage pool (ASP) capacity, utilization, disk arm activity, read and write throughput, transfers, and service times.
Administrators can also examine individual disk units, including read and write activity, wait times, and service times.
In the example below, an overnight batch workload drives ASP read throughput to approximately 750 MiB/s, while service time approaches 1.5 milliseconds. Disk arm utilization remains below the 25% reference line.
These measurements suggest that storage is handling a substantial workload without obvious saturation during the period shown.

Network Performance and Connectivity
Network conditions can also affect IBM i application responsiveness.
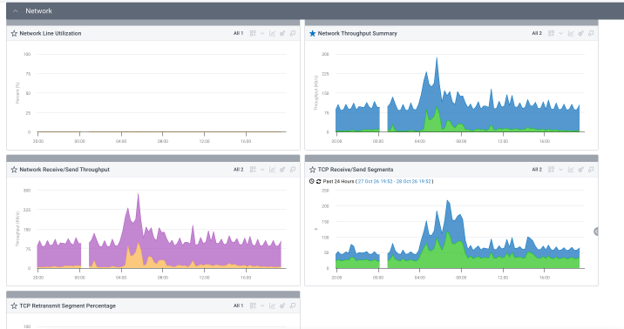
Galileo charts network line utilization, send and receive throughput, TCP segments, and retransmission percentages.
Elevated retransmission rates may indicate network conditions that warrant investigation, particularly when users report intermittent delays or slow application response.
Proactive Problem Detection with Galileo Active Monitor
Historical performance data supports IBM i troubleshooting and planning. Operational events such as failed disks, unanswered inquiry messages, and critical system conditions may require immediate attention.
Galileo Active Monitor monitors IBM i environments for these conditions and generates alerts according to configured collection intervals, thresholds, and severity rules.
Its IBM i monitoring templates cover several important areas:
| Area | Monitoring capabilities |
|---|---|
| QSYSOPR messages | Checks the system operator message queue every 20 seconds, classifies important messages, and filters known routine activity |
| Pending inquiries | Identifies unanswered inquiry messages and includes message details and originating jobs |
| Jobs and CPU | Detects sustained high CPU utilization and jobs waiting on locks (LCKW) |
| Storage health | Monitors disk unit status, ASP utilization, and ASP availability |
| Memory pools | Tracks database and non-database faults across system storage pools |
| Output queues | Monitors QEZJOBLOG, QEZDEBUG, and QPRINT for accumulating spool files and unexpected growth |
| Security events | Detects selected QSECOFR sign-on activity and invalid password attempts through the security audit journal |
| High availability | Monitors PowerHA® cluster node status |
| System availability | Checks partition reachability and the status of Galileo collection subsystems and jobs |
Table 3. Selected IBM i monitoring capabilities in Galileo Active Monitor.
Alert thresholds can be adjusted for individual systems, helping teams account for differences in workload, configuration, and operational requirements.
Alerts can also be delivered through existing operational workflows, including email, collaboration platforms, on-call tools, and ticketing systems.
For organizations using IBM Maximo®, Galileo Active Monitor can automatically create service requests through its Maximo integration, connecting detected problems with established asset management workflows.
Addressing the IBM i Skills Gap with Better Monitoring
The findings from Fortra's survey align with many of the concerns raised during IBM TechXchange. As experienced administrators retire, consistent IBM i troubleshooting practices become increasingly important for maintaining reliable operations.
IBM i teams need to maintain system reliability while managing skills shortages, security requirements, and high availability expectations.
Galileo supports those responsibilities in several ways:
- Preserving operational knowledge: Historical performance data and established analytics rules give administrators consistent information for evaluating system behavior.
- Improving visibility into security events: Monitoring selected audit journal events helps teams identify activity requiring investigation and supports broader security monitoring practices.
- Supporting high availability: Monitoring PowerHA cluster status and ASP availability helps teams identify conditions that could affect recovery readiness.
- Reducing manual investigation: Consolidated dashboards, automated analysis, and contextual alerts help administrators prioritize their attention.
These capabilities are particularly useful for teams responsible for multiple IBM i LPARs or environments spanning several technologies.
See Galileo's IBM i Troubleshooting Capabilities in Action
The conversations at IBM TechXchange reinforced how much organizations continue to depend on IBM i and the importance of giving administrators the tools and information they need to keep those systems running reliably.
With Galileo, teams can identify developing problems, investigate performance issues using detailed historical data, and respond to critical conditions through real-time alerting.
See what that looks like in your environment. Schedule a personalized demonstration of Galileo's IBM i capabilities.
IBM, IBM TechXchange, Power, AS/400, Db2, Power11, Power9, PowerHA, and Maximo are trademarks or registered trademarks of International Business Machines Corporation in the United States and/or other countries.