AIX Performance Monitoring
The industry’s most powerful monitoring, optimization, and strategic management solution for modern and legacy AIX® environments, living on‑prem or in the cloud.
🚨 IBM® Power11 is here — and Galileo is ready.
Built for AIX & IBM i, Galileo delivers full-stack visibility,
real-time insights & deep Power metrics from day one.
Designed for AIX Systems
Finding tools to monitor IBM® AIX environments is challenging. That’s why we designed Galileo.
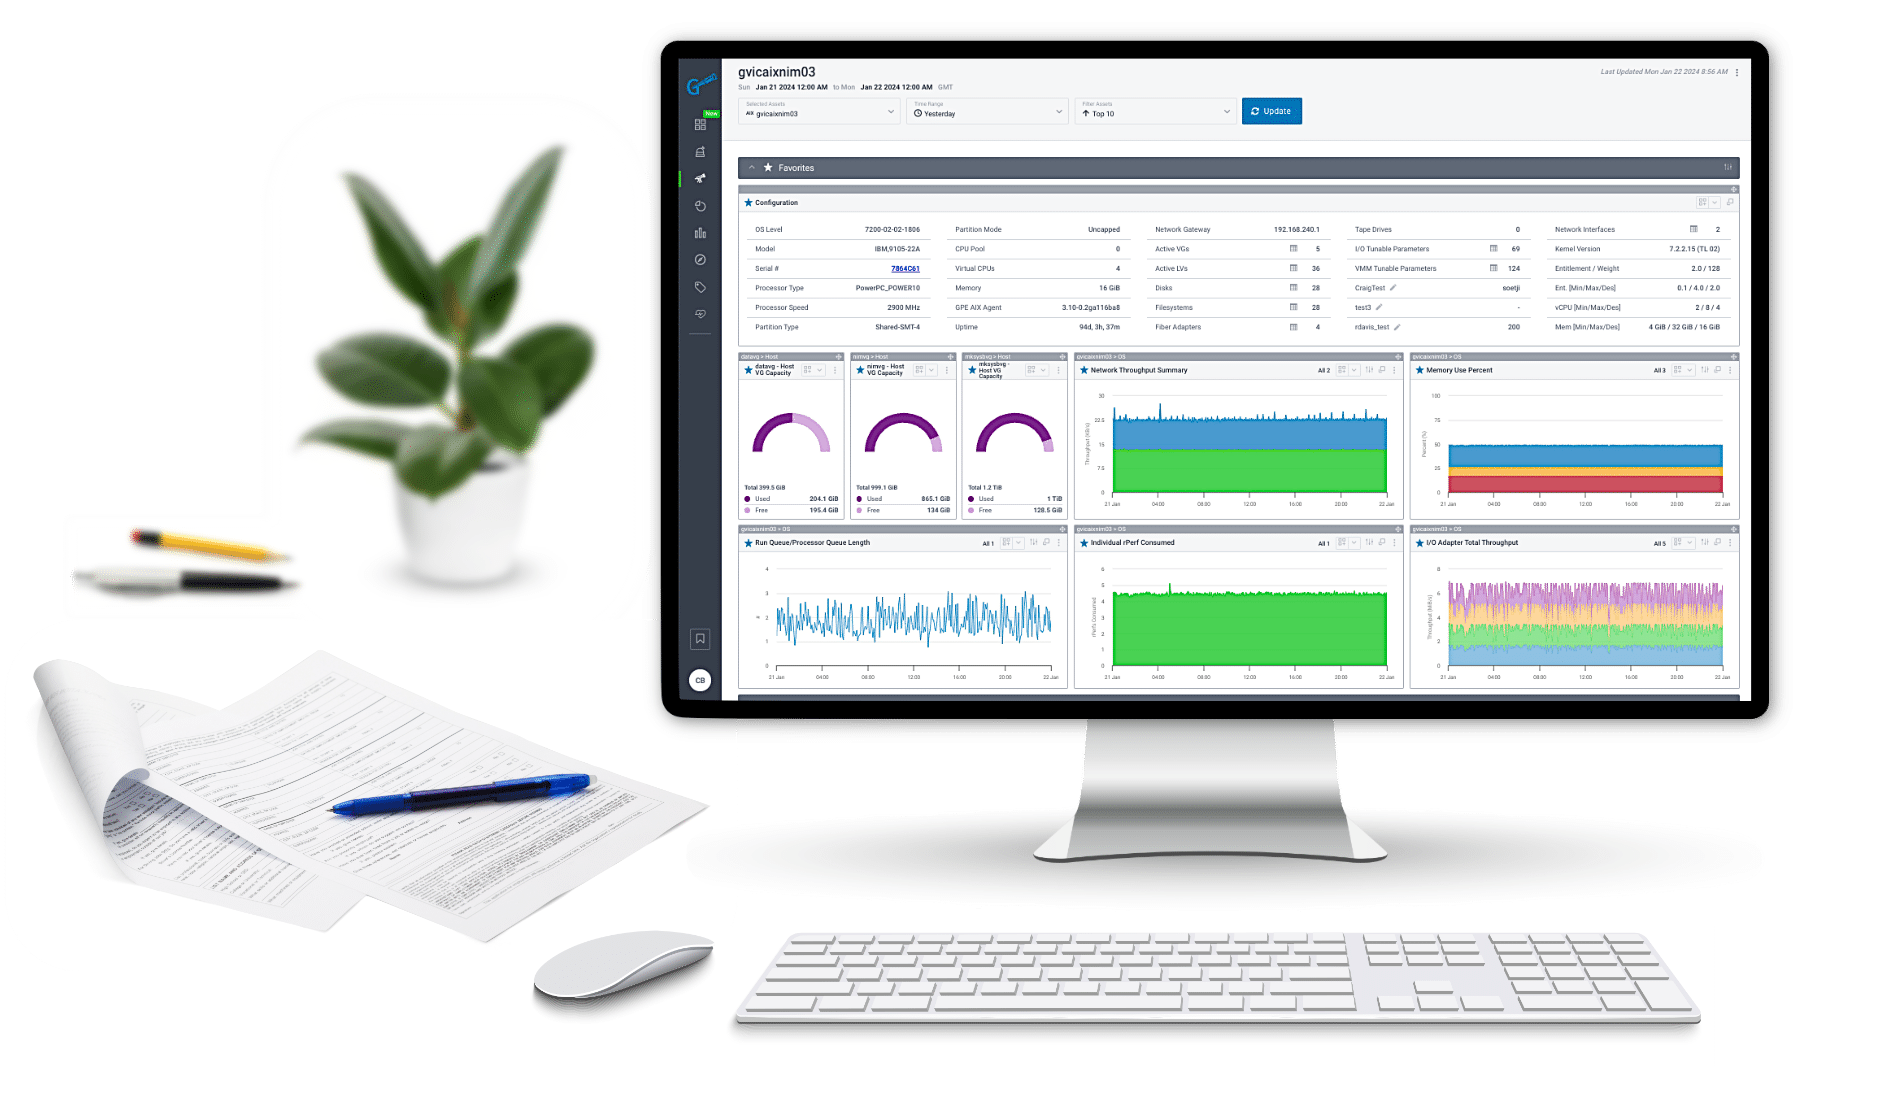
Meticulously crafted for AIX systems in 2007, Galileo is the only platform that delivers a clear line of sight into the physical and virtual layers of AIX and beyond.

rPerf Ratings & Usage
Eliminate manual calculations.
Galileo does the work for you by applying IBM’s published Relative Performance (rPerf) ratings to your performance data.

PID Tracing
Detect anomalies, prevent issues.
Galileo tracks and stores unique PID details across every AIX instance in perpetuity to identify resources consumed by specific PIDs, and anomalies.

3D Observation
See the complete picture.
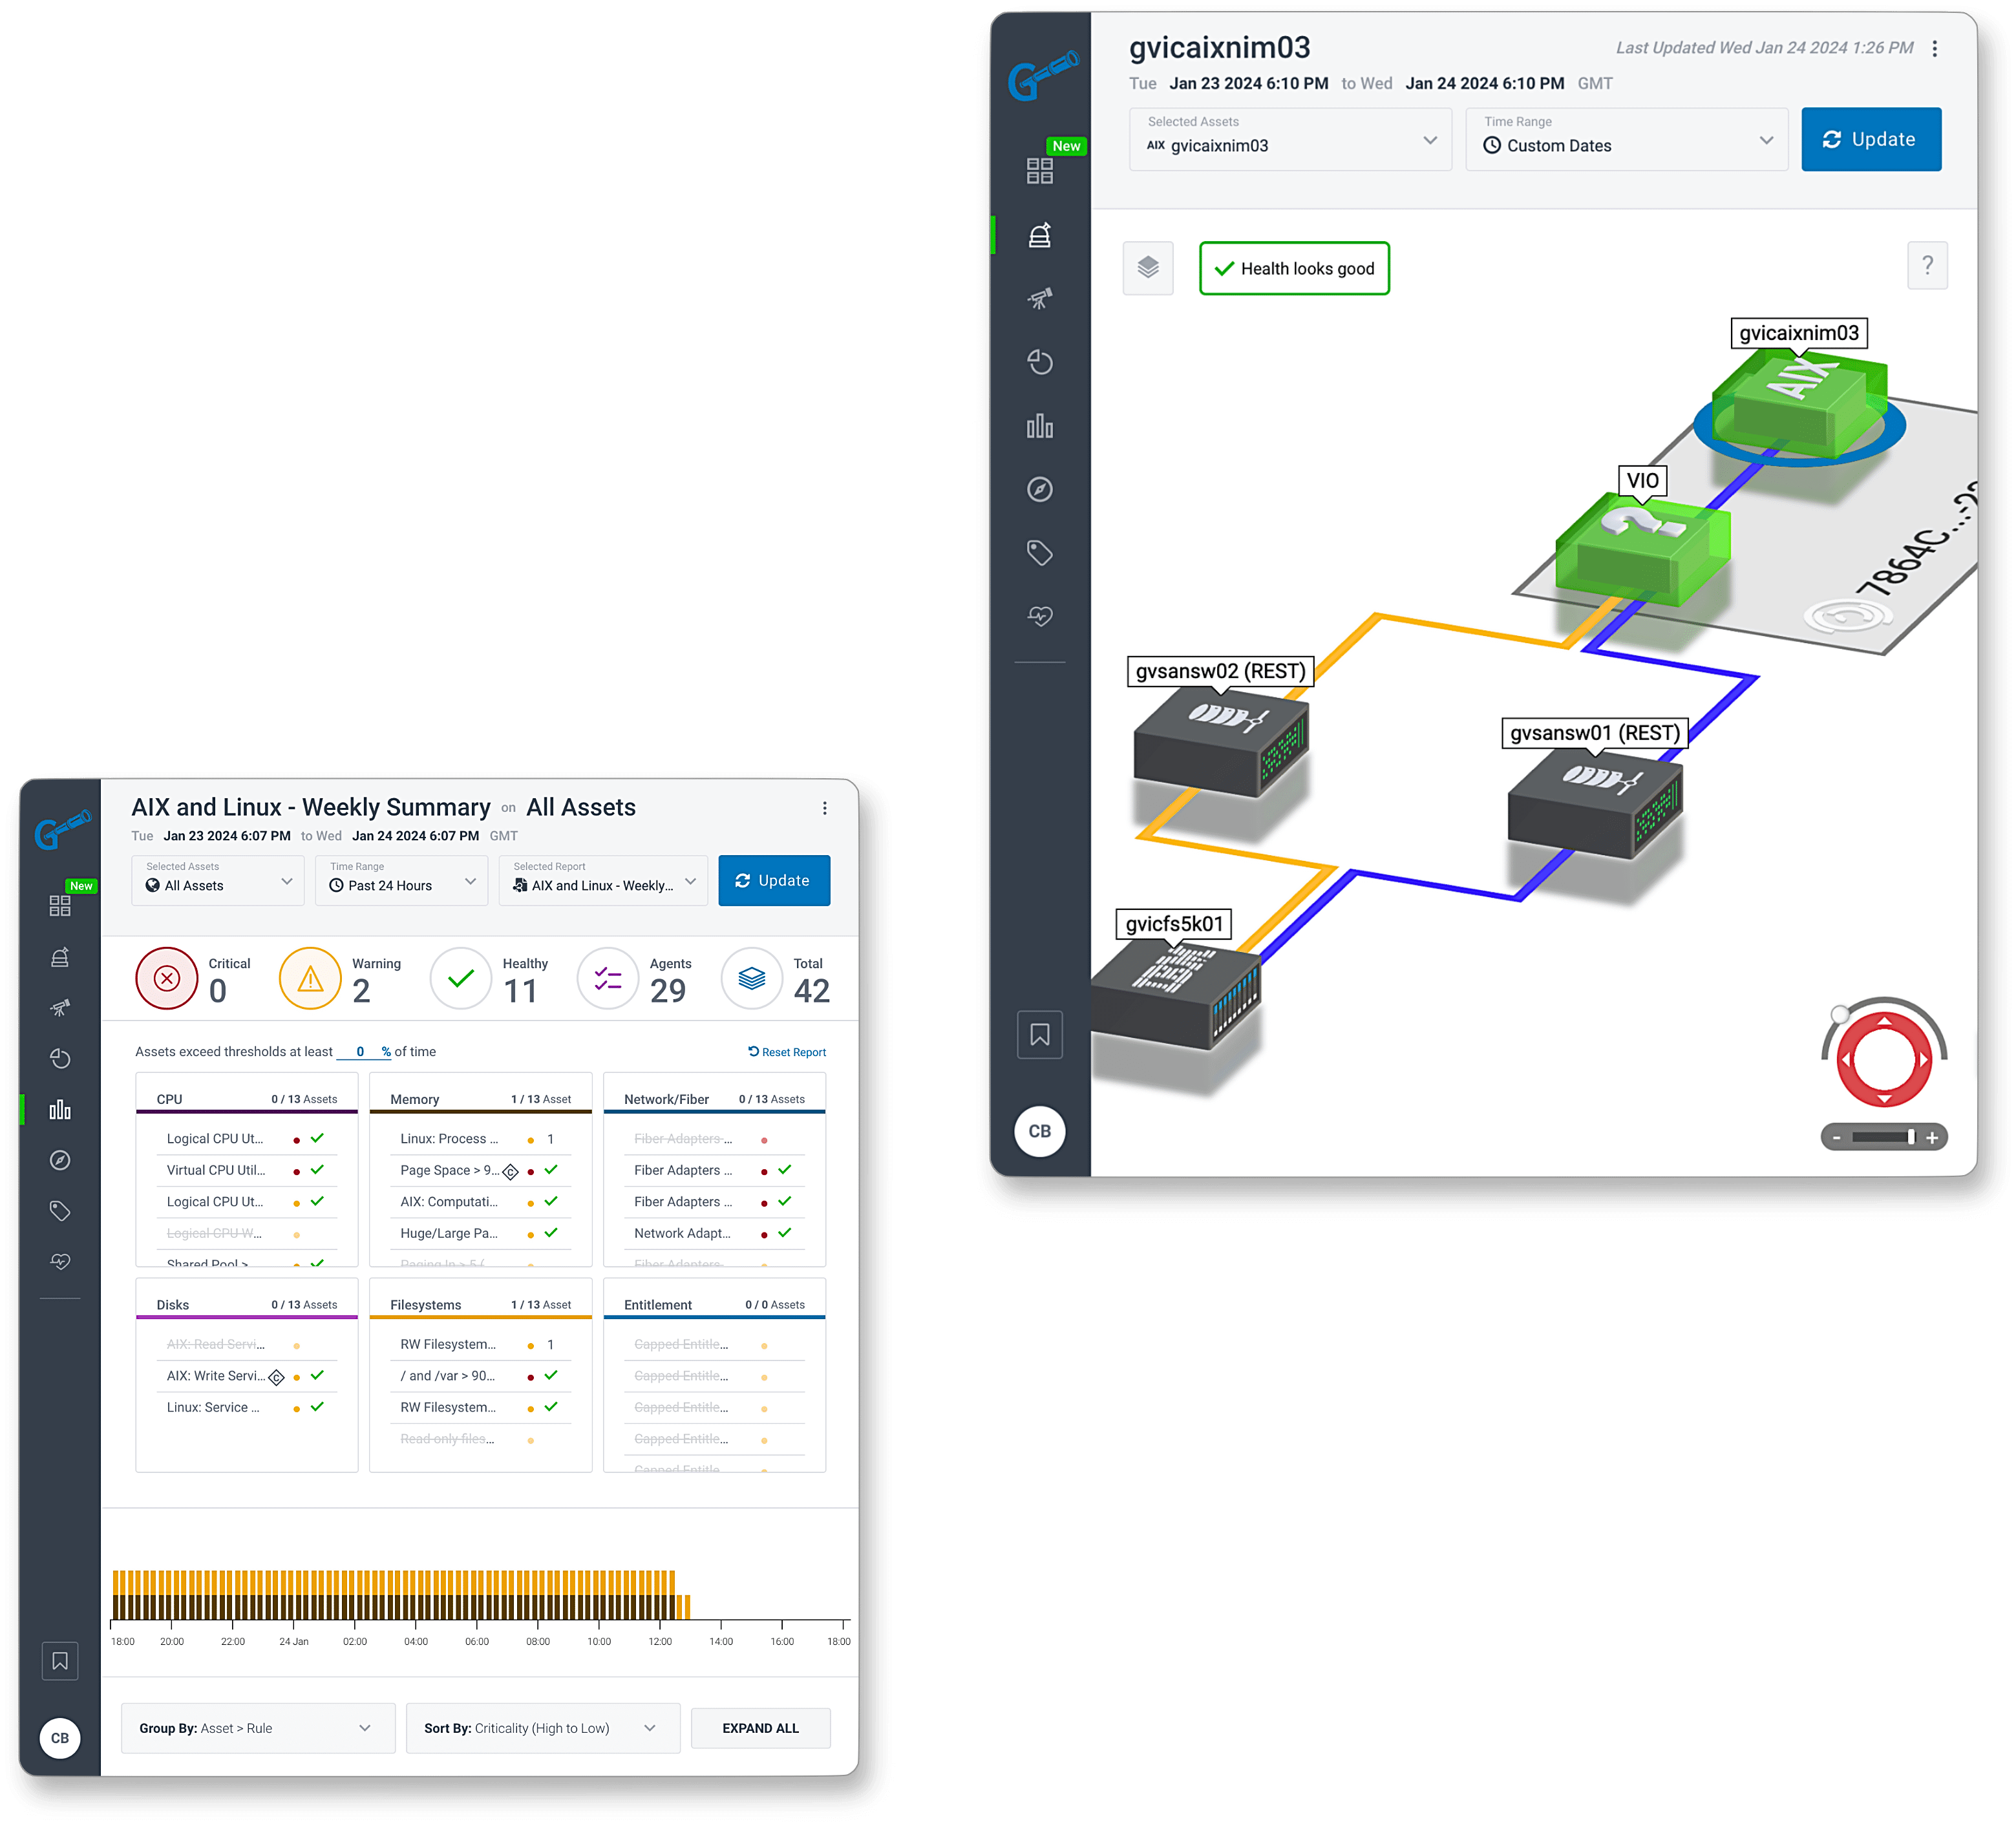
Galileo’s dynamic asset correlation allows you to navigate from an individual AIX LPAR to the Storage and SAN (or vice versa) to quickly identify the source of any issues and what is impacted.
Unrivaled AIX performance monitoring
Thoughtfully created by IBM Power® Systems experts, Galileo provides the most sophisticated AIX performance monitoring in the market today. We help enterprise IT teams cut costs, answer critical infrastructure questions, and optimize the stack without exhausting internal resources.
See for yourself.
- rPerf Forecasting
- Historical Data
- Custom Reporting
- PID Tracing
- 3D Visibility
- Adapter Analysis
- Active Alerting
rPerf Performance
Use live IBM rPerf data to analyze and trend system performance.
Historical Data
No data pruning or rollup means granular, accurate data is always at your fingertips.
Custom Reporting
Get management-level summaries delivered directly to your inbox.
PID Tracing
Use AIX PID data for fast and reliable performance troubleshooting.
3D Visibility
Explore your AIX infrastructure with intuitive 3D navigation.
Adapter Analysis
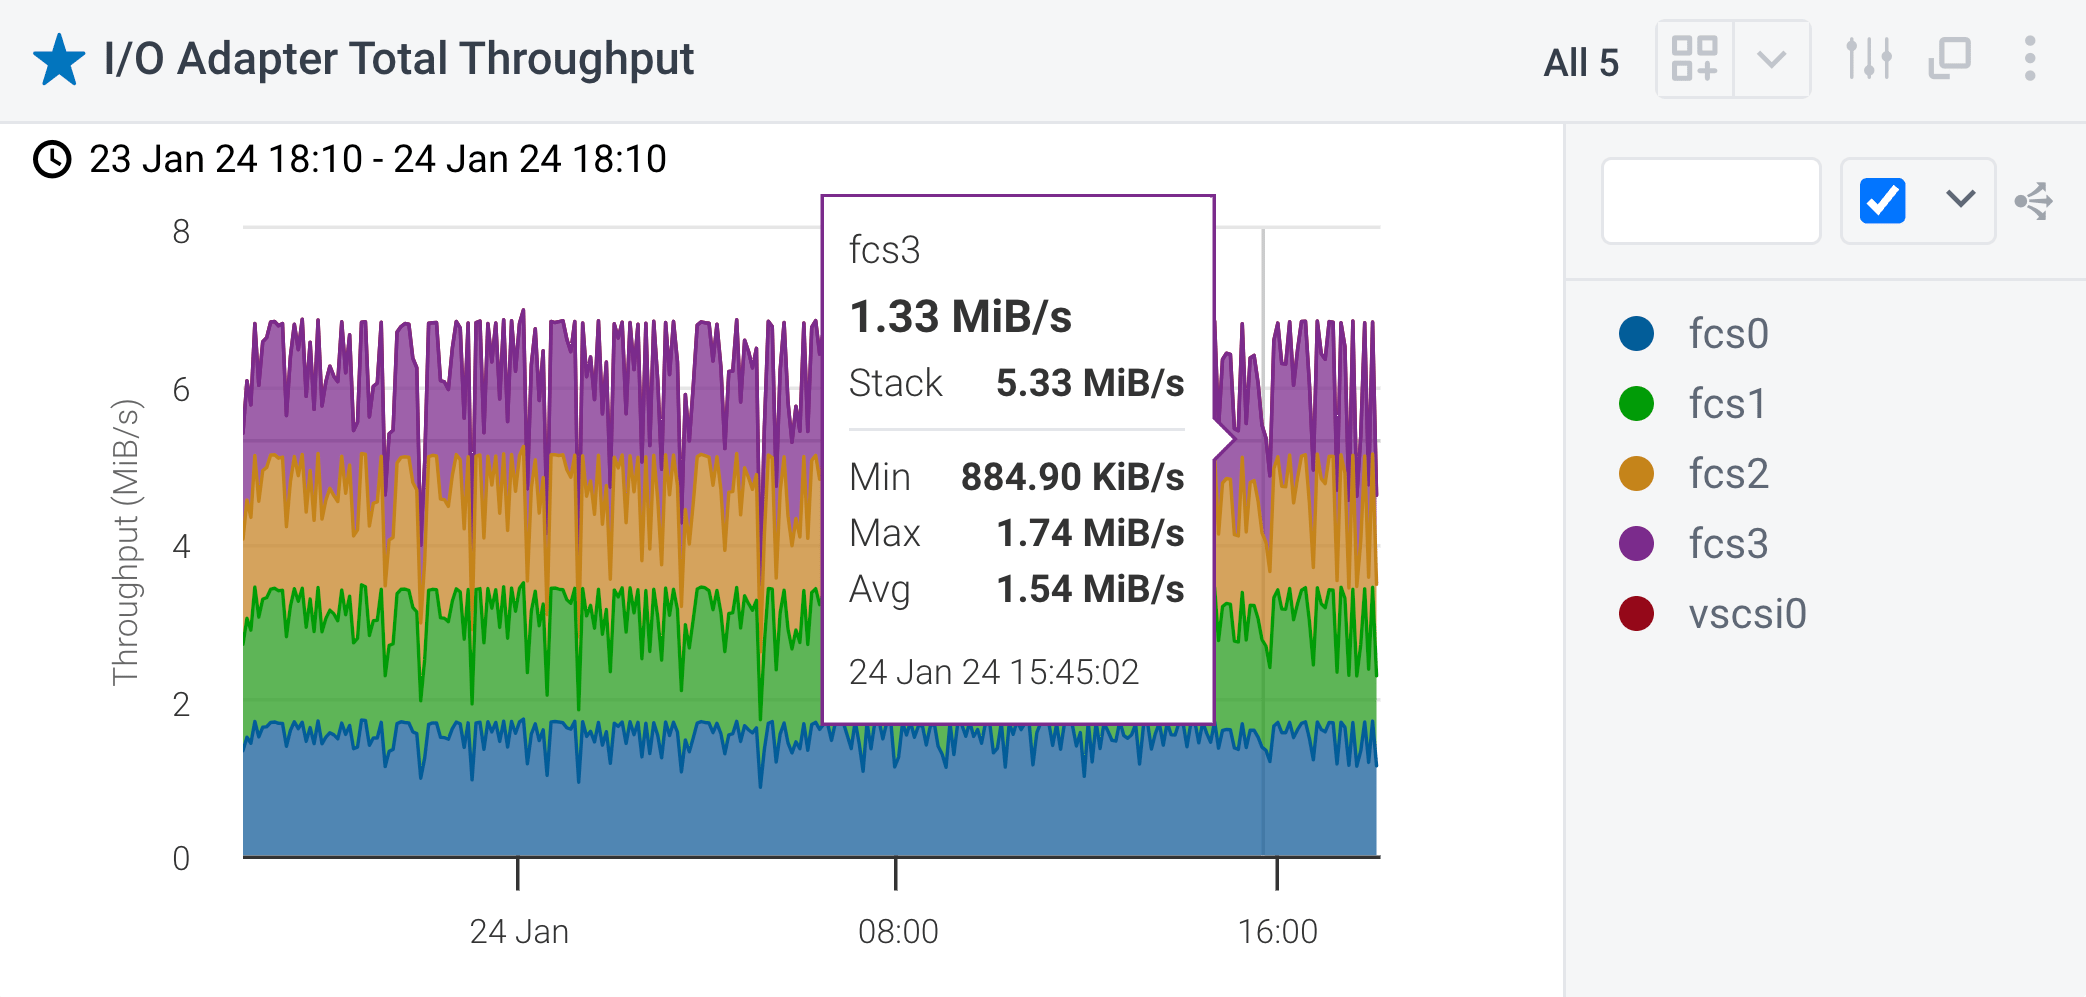
Use Galileo charts to quickly identify issues with adapters.
Active Alerting
Get notified about issues in real time with Galileo Active Monitor.
Comprehensive AIX performance metrics
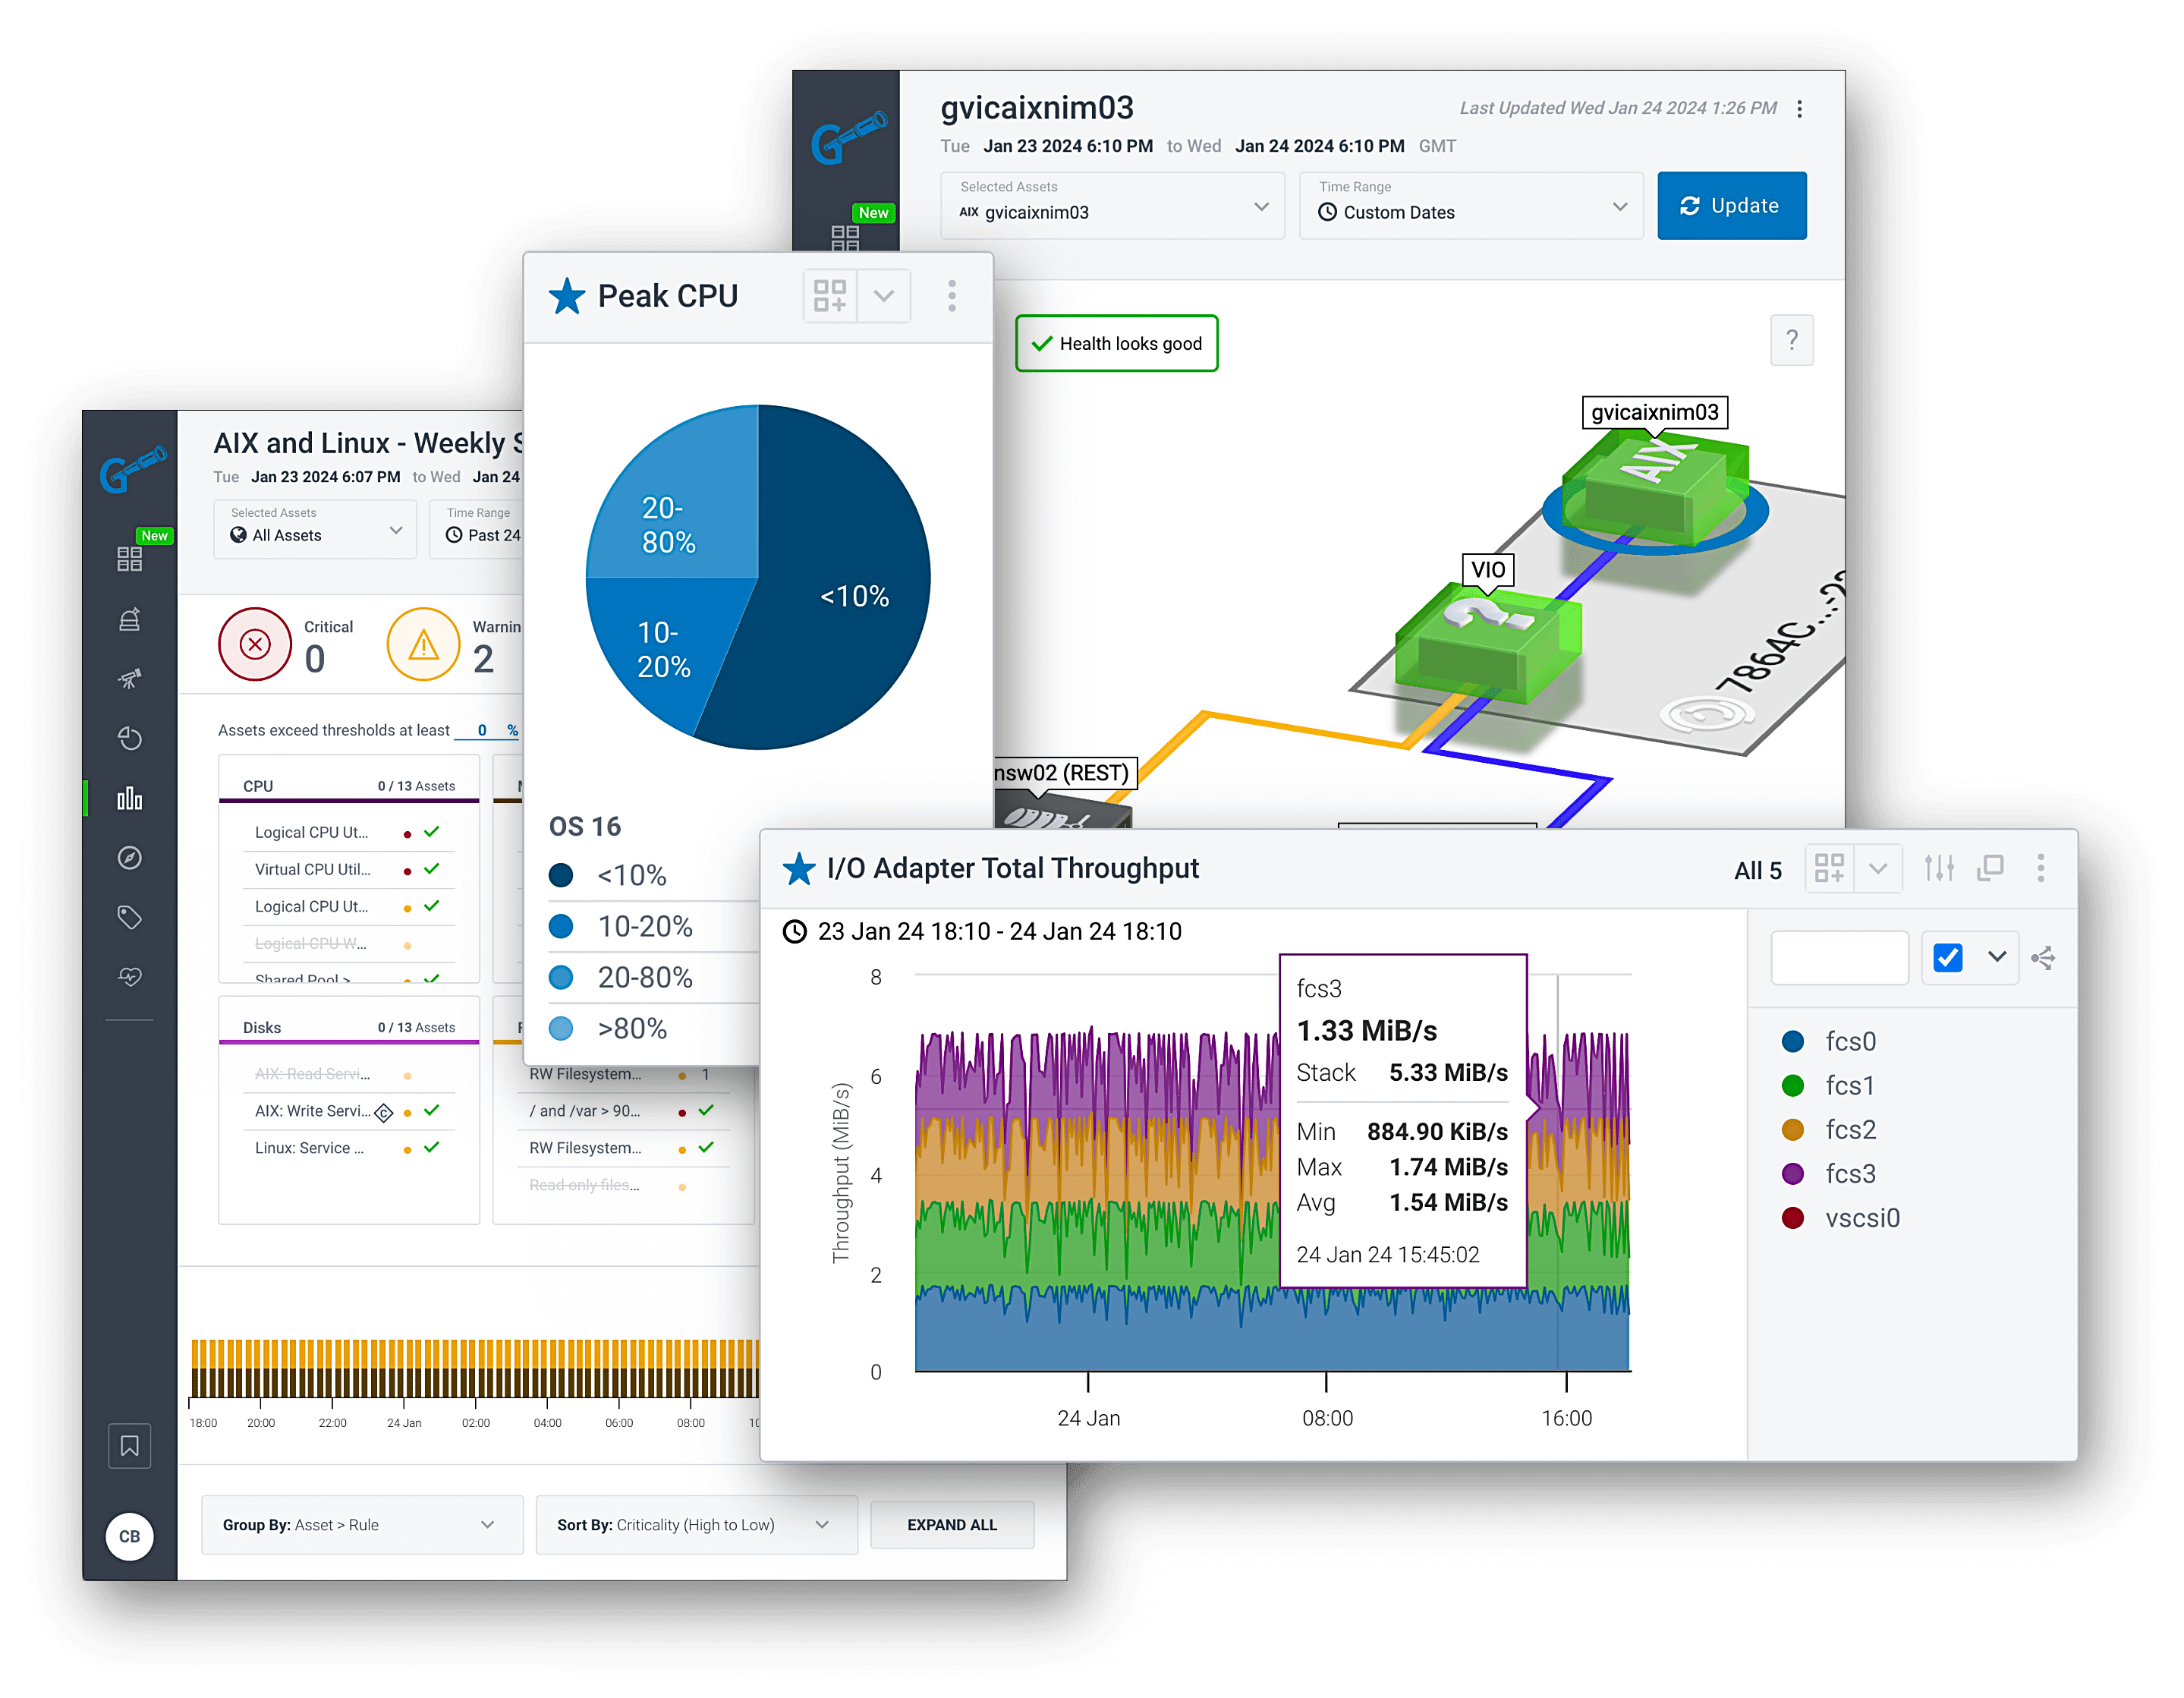
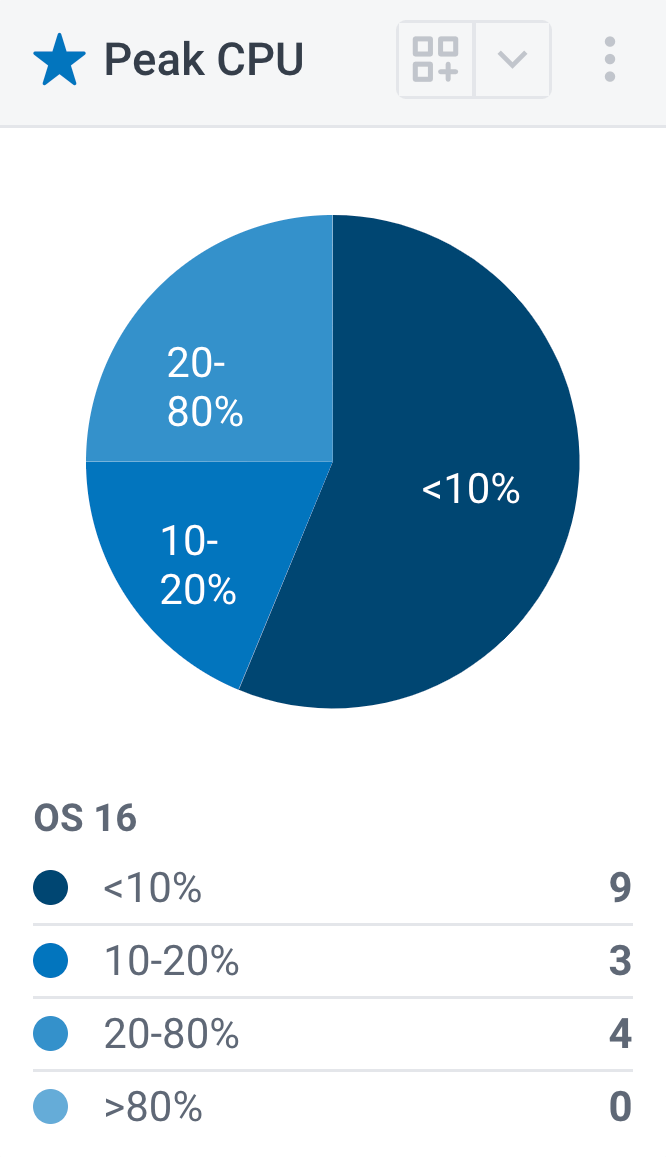
CPU Charts
|
|
Process Charts
|
|
HMC and LPAR Charts
|
|
Memory and Paging Charts
|
|
Adapter Charts
|
|
NFS Charts
|
|
Filesystem Charts
|
|
Network Charts
|
|
GPFS Charts
|
|
Disk and Tape Charts
|
|
Configuration Data
|
|
Ready to get started?
Your free trial includes unlimited access to a fully functional Galileo instance using your data, equipped with pre-configured agents, ready-to-use AIX decision boards, and seamless data integrations with third-party platforms.
Secure and compliant AIX monitoring
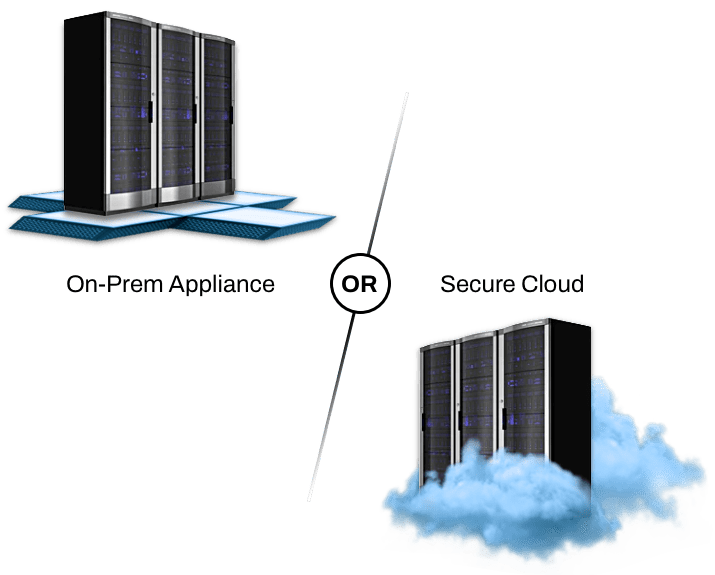
Galileo Cloud or On Premises
Flexible delivery options

Galileo SOC2 Type 2
Committed to Data Protection
Galileo Governance
Compliance Essentials

Praise from our clients
Sr. Systems Engineer
Hospital & Healthcare
We use Galileo to quickly determine the source of any issues, prevent outages, and predict future hardware and storage requirements for the critical patient care applications used by our nurses and doctors.
VP, Technical Resources
Managed Service Provider
Galileo is intuitive, easy to implement, and easy to navigate. The product keeps evolving and even allows us to look at EPIC environments, making it a one-stop shop for our team.
IT Director
Government Agency
Galileo is by far one of the best vendor teams I have seen in my career with a complete focus on the customer.
Cloud Engineer
Health Insurance Provider
With Galileo, I can see accurate measurements and trends to keep my hardware costs down.
Sr. Systems Engineer
Hospital & Healthcare
The data provided by Galileo also helps contribute to important revenue streams within the Health System.
Technical Program Director
Hospital & Healthcare
We use Galileo for real-time troubleshooting, performance management, and reporting. Galileo is also used by our governance teams to ensure our service providers meet our SLA and KPIs.
Cloud Engineer
Health Insurance Provider
The data provided by Galileo is far superior to what we are getting from Nutanix. Prism Central often reports that we are out of capacity, but Galileo consistently proves otherwise.
System Admin Manager
Financial Services
Galileo tells us if our environment is configured correctly in 5 seconds instead of 5 hours.
See more Galileo user reviews on Capterra.com.
Trust your AIX environment to the experts
Nobody knows AIX like we do. Galileo provides the most comprehensive tool for monitoring, reporting, and optimizing AIX environments, and we are relentless in the pursuit of your success. Get started today.

See it!
Schedule a live demo tailored just for you.
See how Galileo delivers the data, visibility, and transparency you need.

Try it!
Start your 30-day FREE trial.
Experience unrestricted Galileo access, stress-free setup, and relentless support.
Buy it!
Get a quote.
Contact a Galileo Solution Advisor to get started with your personalized quote.

