
How do you reap the savings benefits promised by the cloud if you can’t make an educated decision based on its actual costs?
_x000D_
Use this Free Cloud Cost Comparison Report to help you compare your workload to the current pricing data from AWS & Azure so you can make a smart cloud decision in minutes._x000D_
_x000D_
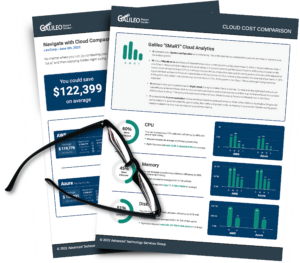
Sample Cloud Cost Comparison Report
Click to Enlarge
_x000D_
Most of the companies we work with have been burned financially by doing a lift-n-shift migration, or they were bogged down in months of resource-intensive work to do a proper pricing exercise._x000D_
_x000D_
There has to be a better way._x000D_
_x000D_
We want to get you out of the tedious, life-draining cloud accounting work and back into IT._x000D_
_x000D_
That’s why we recently released a new Cloud Cost Comparison Report. This report will help you evaluate your Linux and Windows workload (including virtualized workload running on VMware and Nutanix) and connected storage and compare it to the current pricing data from AWS and Azure so you can make an intelligent cloud decision in minutes._x000D_
_x000D_
This report is part of Galileo Cloud Compass, and for a limited time, you can get your customized Cloud Optimization report absolutely FREE! All you have to do is sign up for a Galileo Proof-of-Concept 30-day trial._x000D_
_x000D_
 _x000D_
_x000D_
Inside Your FREE Cloud Cost Comparison Report
_x000D_
Your FREE Cloud Cost Comparison Report delivers SMaRT Cloud Analytics in an easy-to-read PDF. No complex configurations or hours spent pouring through endless data points. You’ll be able to decide the best cloud configuration for your workload in minutes._x000D_
_x000D_
Page 1 of the Report_x000D_
- _x000D_
- Your ultimate savings card.
- AWS Pricing Breakdown.
- Azure Pricing Breakdown.
_x000D_
_x000D_
_x000D_
_x000D_
Page 2 of the Report_x000D_
_x000D_
You’ll get detailed SMaRT Cloud Analytics for the CPU, Memory, and Disk in your tagged environment or workload._x000D_
- _x000D_
- S represents your System configuration as it exists today.
- M depicts your Migrate as-is workload and shows how your current system configuration maps to AWS or Azure instances.
- R shows how your workload can be Right-sized to utilize a smaller cloud instance.
- T details the True consumption of your workload based on peak performance.
_x000D_
_x000D_
_x000D_
_x000D_
_x000D_
_x000D_
_x000D_
No matter where you decide to run your infrastructure, Galileo can help you save BIG. This report is yours free, for a limited time, with a Galileo Proof-of-Concept 30-day trial._x000D_
_x000D_
Don’t wait – get your customized Cloud Cost Comparison Report for free today!_x000D_
_x000D_
_x000D_
_x000D_
Cloud Compass can provide fast insight into thousands of systems and easily spot waste. (Yes, even AIX & IBM i)_x000D_
What kind of savings will it uncover for you?_x000D_
_x000D_
_x000D_
_x000D_