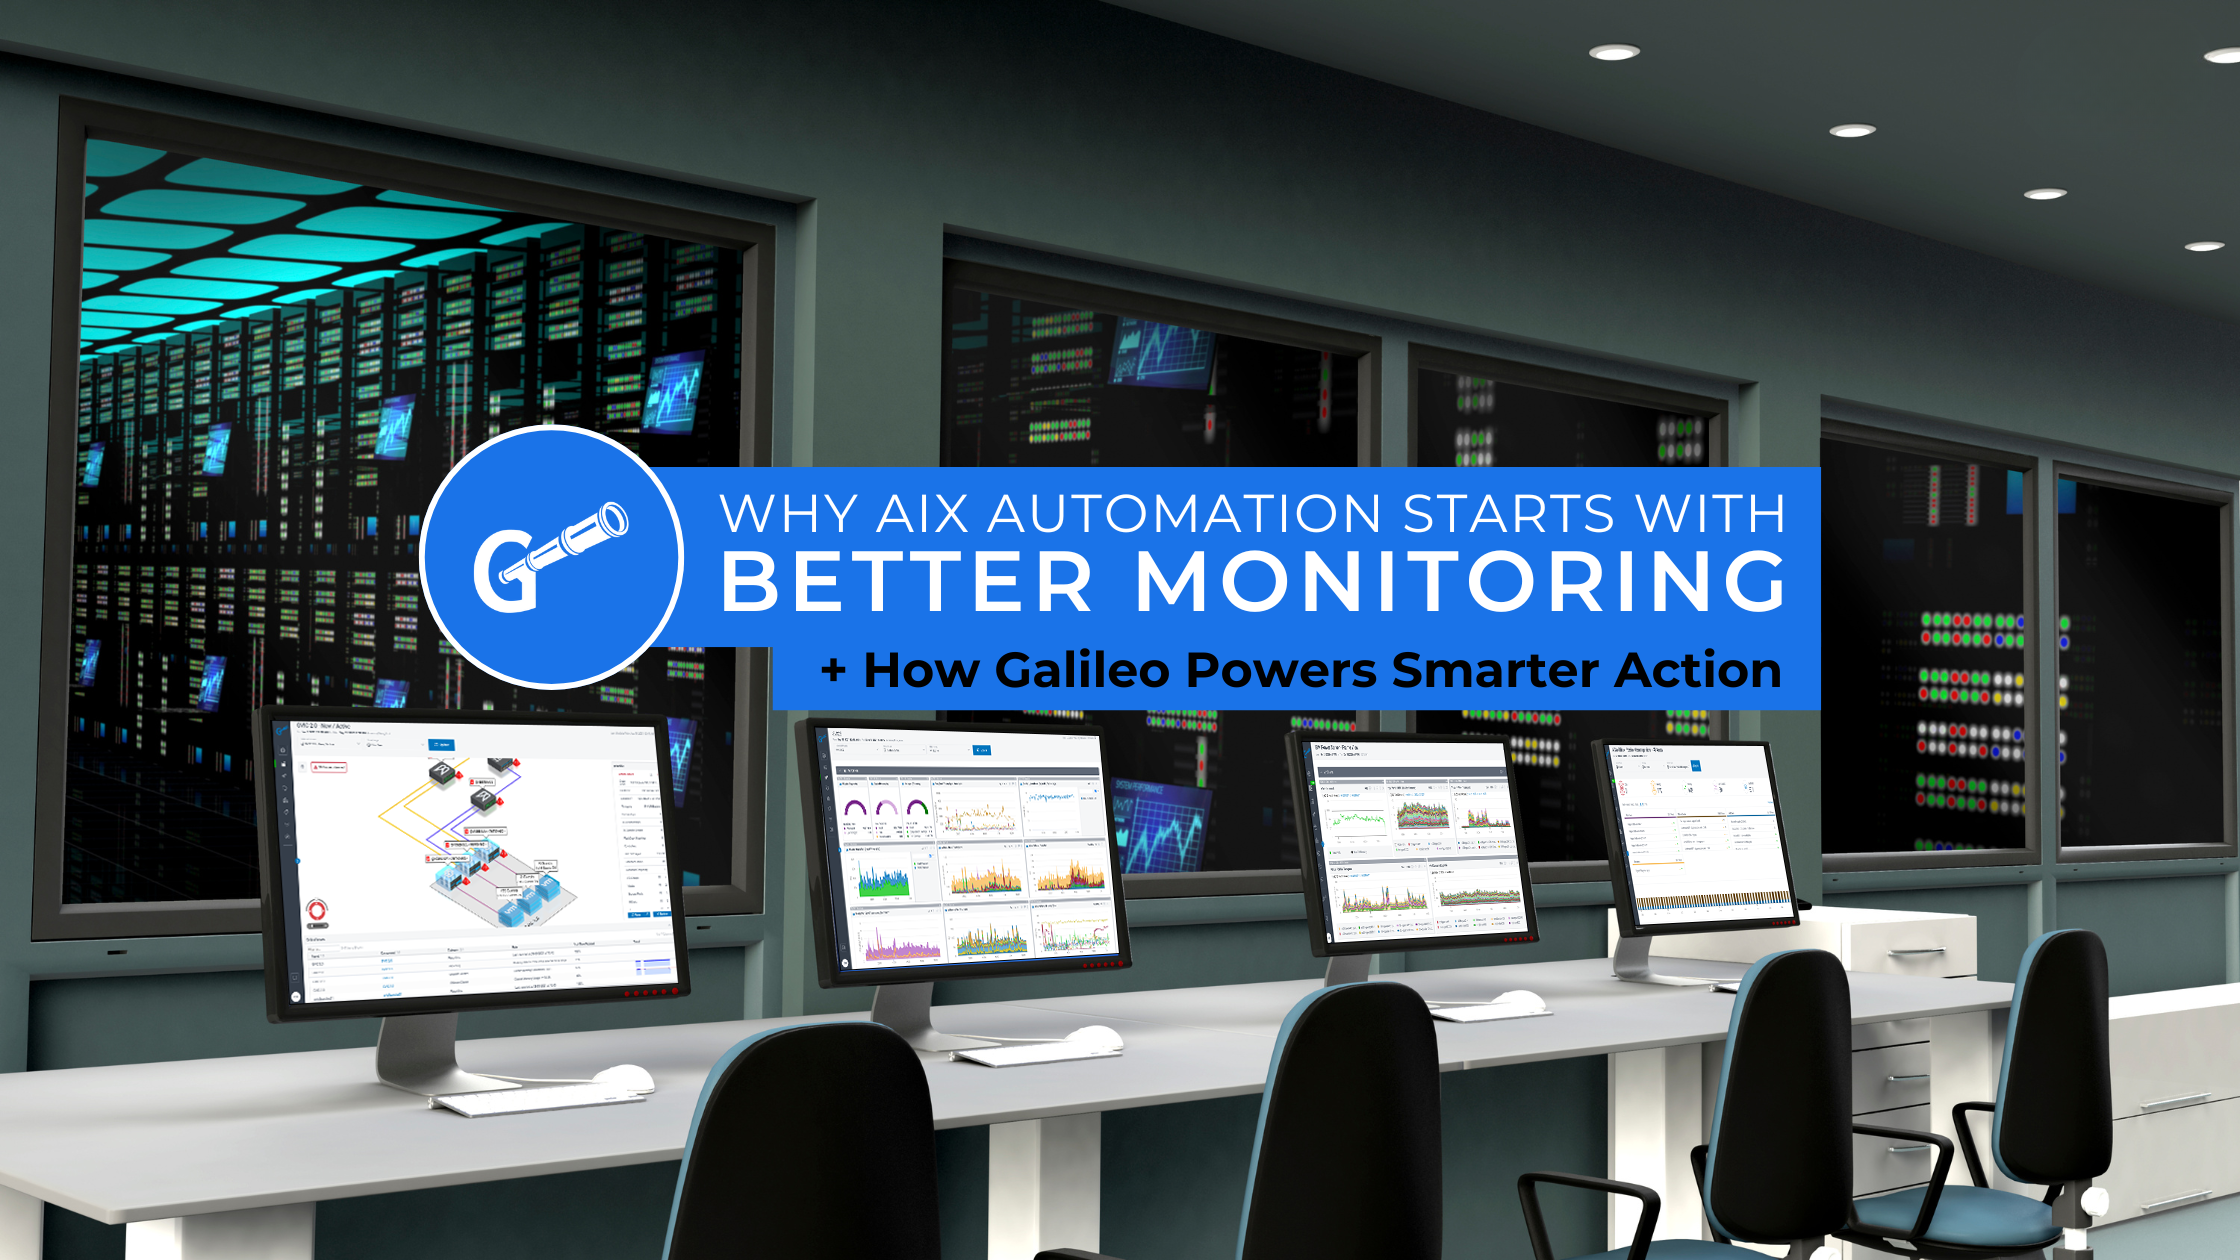
If your automation can’t trust the data it’s acting on, it’s not automation. It’s a guess.
That’s why AIX automation monitoring is the foundation for success.
Many teams encounter this gap when trying to automate AIX operations. Red Hat Ansible Automation Platform (AAP) and Event-Driven Ansible (EDA) can absolutely streamline routine tasks, like expanding filesystems or tuning adapters. But every playbook still depends on one thing: accurate, real-time monitoring.
That’s where Galileo comes in.
While the ATS automation blog series explores how to build powerful AIX automations, this post highlights the foundation that makes them possible. Galileo’s infrastructure monitoring platform provides the depth, clarity, and historical context needed to drive meaningful action before issues disrupt your environment.
Why AIX Automation Monitoring Comes First
Automation can execute a task. But it can’t decide when that task is necessary (or safe) without monitoring.
Whether you’re triggering a playbook from Zabbix, integrating with ServiceNow, or using human approvals, your automation success depends on:
- Knowing when something is out of alignment
- Understanding how critical the issue is
- Seeing whether the problem is isolated or widespread
AIX automation monitoring provides that clarity. Galileo delivers unified visibility across your AIX infrastructure, combining real-time telemetry with long-term historical context that goes beyond basic alerts.
AIX Automation Monitoring Metrics That Power Smarter Decisions
Galileo is purpose-built for IBM Power Systems, capturing far more than up/down checks.
It collects, stores, and analyzes an expansive set of AIX-specific metrics, including:
- CPU & Performance: Utilization by mode, rPerf normalized usage, shared pool behavior, run queue depth, entitled vs. consumed CPU
- Memory & Paging: Real and virtual memory, large page stats, VMM and IOO parameters, scan/free ratios
- Filesystem & Disk: Percent utilization, inode usage, throughput, latency, service queue depth
- Network & Adapter: Send/receive rates, error rates, shared Ethernet adapter stats, Fibre Channel adapter health
- Processes & PIDs: Every PID tracked forever for forensic-level analysis of jobs, leaks, or rogue activity
- GPFS & NFS: Distributed filesystem stats, node throughput, and RPC behavior
BONUS:
Galileo retains every PID detail indefinitely, enabling deep analysis and troubleshooting beyond what traditional monitoring tools can deliver.
Expanding the View: Hardware, Virtualization, and System Events
Beyond core AIX metrics, Galileo also integrates tightly with the broader IBM Power ecosystem:
- HMC Monitoring: Hardware-level visibility into partitions, firmware health, power and cooling metrics, capacity on demand, and hardware error logs, ensuring administrators can correlate system performance with underlying physical resources.
- VIO Server Monitoring: Tracks virtualized I/O throughput, SEA (Shared Ethernet Adapter) performance, virtual Fibre Channel mappings, and adapter availability, giving insight into the health of the I/O fabric that underpins AIX workloads.
- OS-Level Event Logs (errpt): Continuous capture and analysis of AIX’s error reporting facility (errpt), surfacing hardware faults, OS warnings, and kernel-level issues in real time, enabling proactive troubleshooting before they impact production.
With these additional layers, hardware (HMC), virtualization (VIO), and event-level intelligence (errpt), Galileo delivers a truly end-to-end monitoring fabric for IBM Power and AIX. This holistic approach empowers IT teams to move beyond reactive firefighting and make smarter, data-driven decisions about performance, capacity, and risk.
Forecasting with AIX Automation Monitoring
What makes Galileo different isn’t just the volume of metrics. It’s the insight you can gain from them.
- Filesystem trend lines predict how many days until capacity thresholds are breached
- rPerf forecasts highlight where workload growth is outpacing entitlements
- Adapter tuning insights reveal drift from baseline configurations
This means AIX automation monitoring doesn’t just support reactive playbooks. Galileo feeds automation with predictive intelligence, ensuring smarter action before problems escalate.
How Galileo Strengthens Common AIX Automation Use Cases
Here’s how Galileo enhances the same automation use cases featured in the ATS blog series:
Filesystem Recovery
Galileo tracks usage patterns and forecasts growth. Instead of waiting for Zabbix to alert at 98%, Galileo can show if that threshold will be reached in 3 days or 3 hours. With Galileo Report Studio, teams can even receive weekly filesystem risk summaries straight to their inbox.
Network Performance Restoration
Galileo captures TCP tunables and throughput over time, helping teams spot drift, compare LPAR configurations, and verify the impact of playbooks after remediation.
Fibre Adapter Tuning
Detailed Fibre Channel and virtual adapter metrics (including num_cmd_elems, anomalies, and errors by port) support smarter tuning and redundancy validation before automation runs.
Capacity Planning
With Galileo SMARTboards, teams can visualize CPU donations, memory saturation, and rPerf consumption across environments. The result: informed automation that prevents over-provisioning and wasted resources.
Custom Reporting for AIX Automation Monitoring
Automation decisions aren’t made only at the alert level; they’re often made in planning meetings. That’s why Galileo Report Studio is invaluable.
Teams can design role-specific AIX automation monitoring reports and deliver them automatically, without logging in. Examples include:
- Disk usage summaries with risk scoring
- CPU entitlement savings reports
- Adapter configuration drift analysis
- Monthly capacity trend reports for executive review
These reports can inform playbook logic or flag systems that are and aren’t ready for automation.
SMARTboards: A Better View of What Matters
Galileo SMARTboards provide customizable dashboards for the metrics that matter most across AIX, IBM Power, and hybrid environments.
- Compare memory utilization across multiple LPARs
- Track which systems exceeded I/O thresholds over the past week
- Pinpoint adapters consistently spiking beyond alert limits
SMARTboards transform raw monitoring data into a clear view that directly supports automation strategies.
Final Thought
Automation gets the spotlight, but monitoring is the foundation that makes it work.
Galileo provides AIX teams with the deep visibility, forecasting, and custom reporting needed to make wise decisions before playbooks ever run.
If you’re planning to scale automation, don’t start with scripts. Start with AIX automation monitoring.
Schedule a custom demo to see how monitoring strengthens your automation strategy.


