IBM Infrastructure Monitoring
Unified observability for IBM Power and Storage environments
Galileo delivers the visibility and insight that IBM® Systems demand. Built by IBM experts, it provides deep, continuous monitoring across IBM Power Systems™ (AIX® and IBM i) and Storage, correlating performance data across your entire environment to accelerate troubleshooting, improve efficiency, and enable smarter planning.

Unrivaled IBM Systems Observability
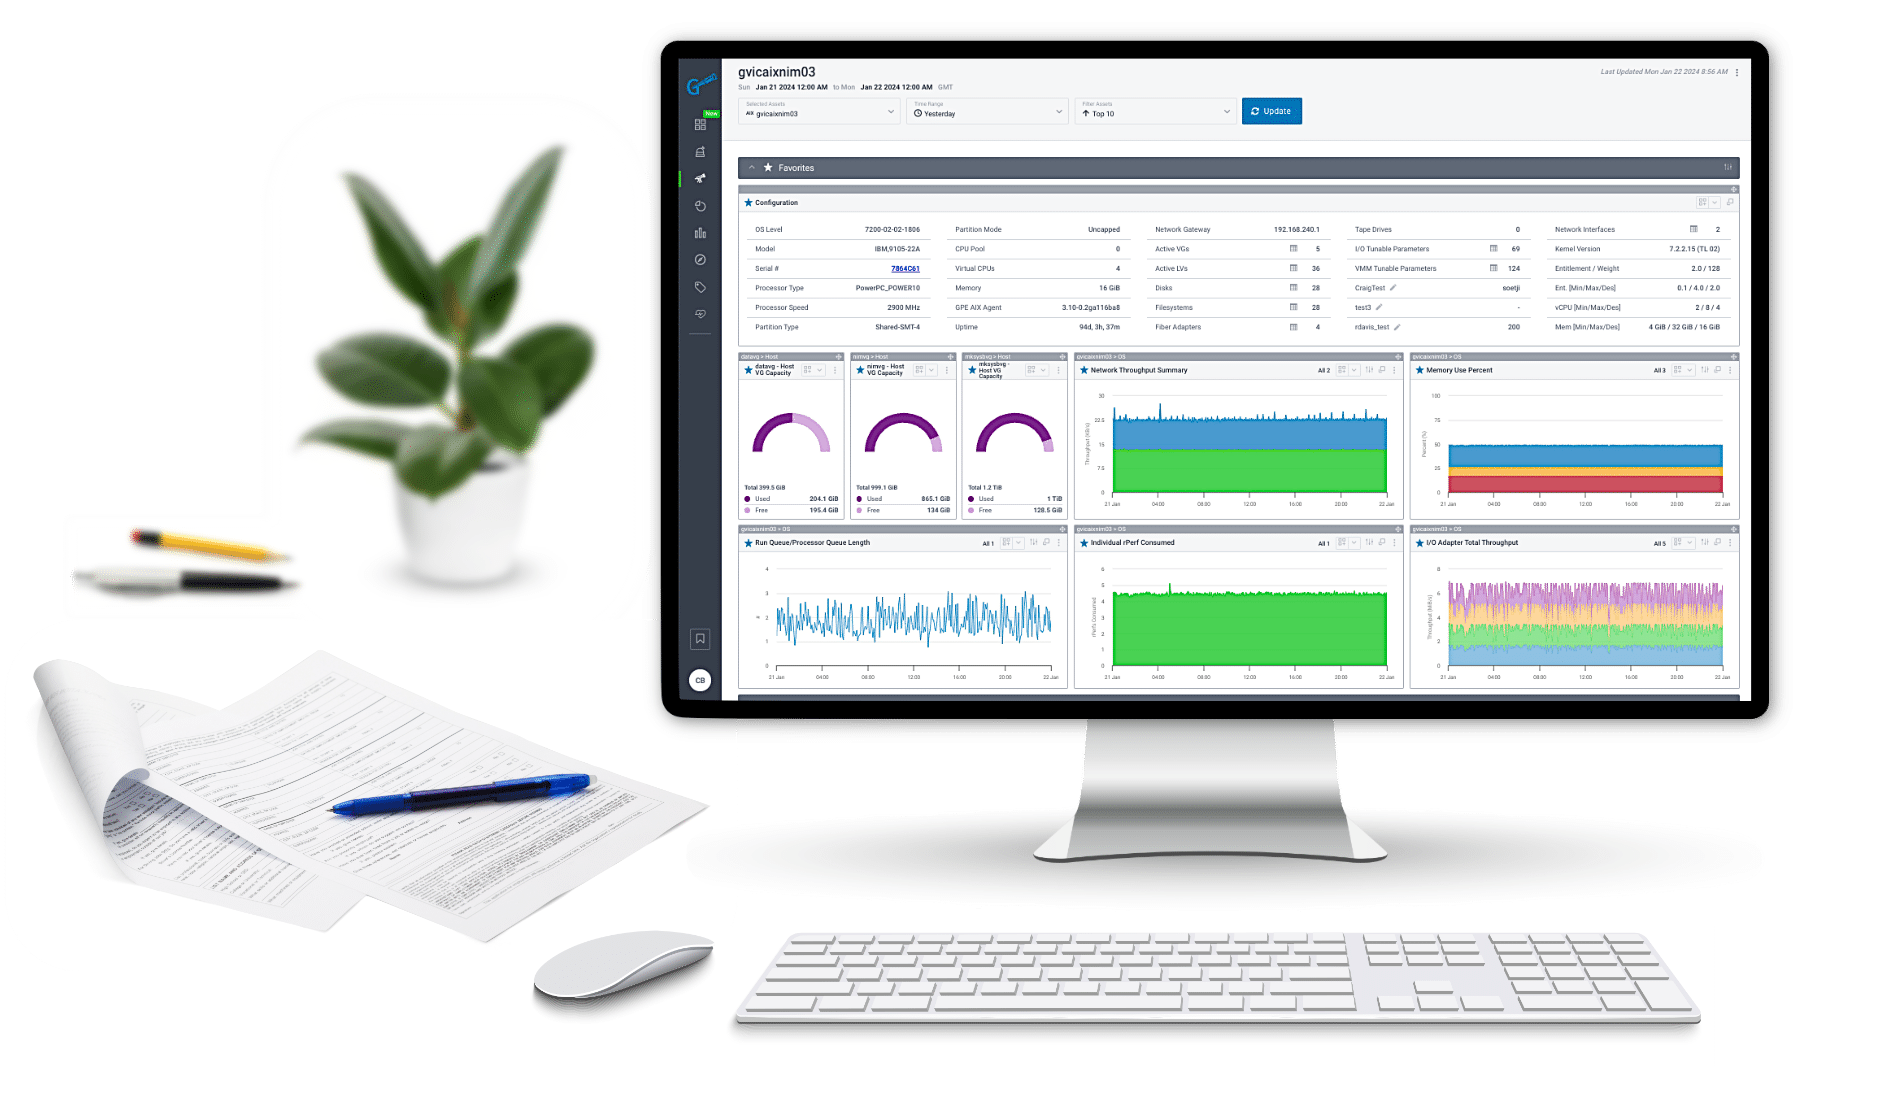
Galileo gives IT teams the depth of insight other tools can’t match.
From AIX and IBM i to the full IBM Storage portfolio, Galileo delivers visibility across every layer of your IBM infrastructure, with the added advantage of correlating it to the rest of your environment.

OPTIMIZE
Maximize the performance and efficiency of Power and Storage with granular visibility that exposes waste, hotspots, and opportunities to right-size.

AUTOMATE
Eliminate manual effort with custom reporting, proactive alerts, and insights that keep IBM environments healthy without constant intervention.
INTEGRATE
Correlate IBM Power and Storage telemetry with the rest of your infrastructure in one platform, removing blind spots and disconnected tools.

INFORM
Back every decision with granular historical data and forecasting — from capacity planning to workload analysis.
Thousands of IBM Metrics. One Unified View.
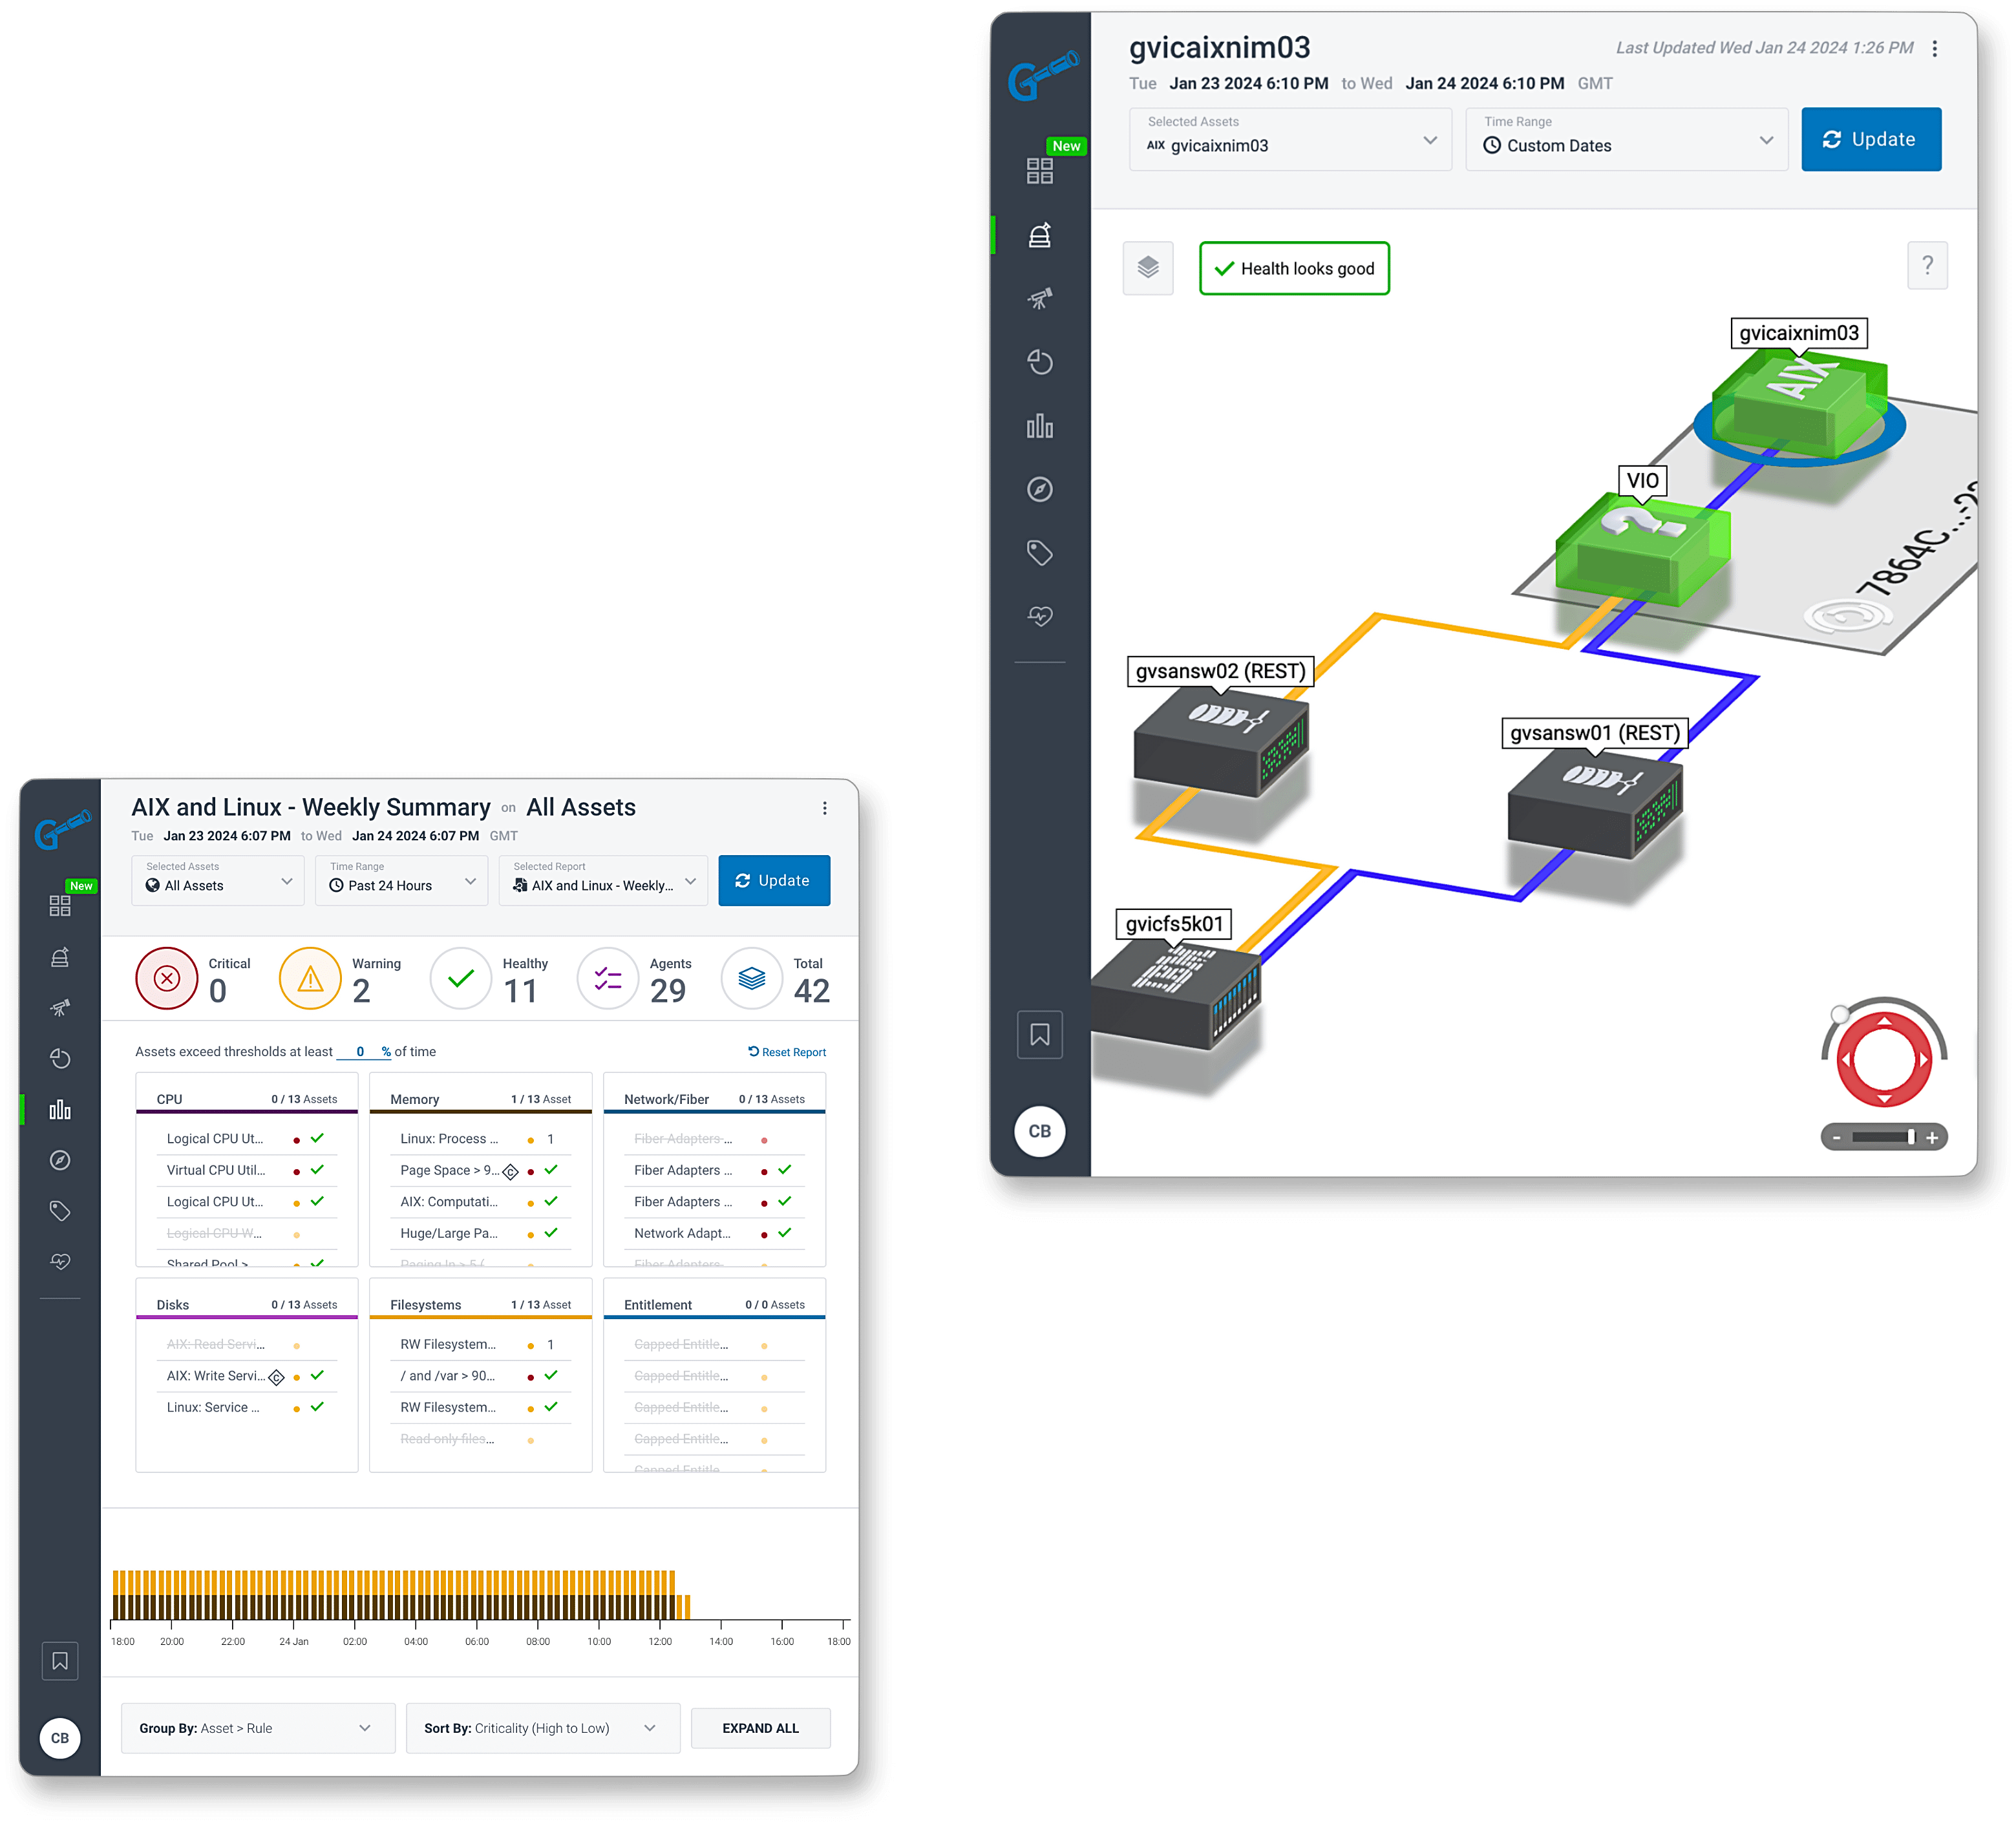
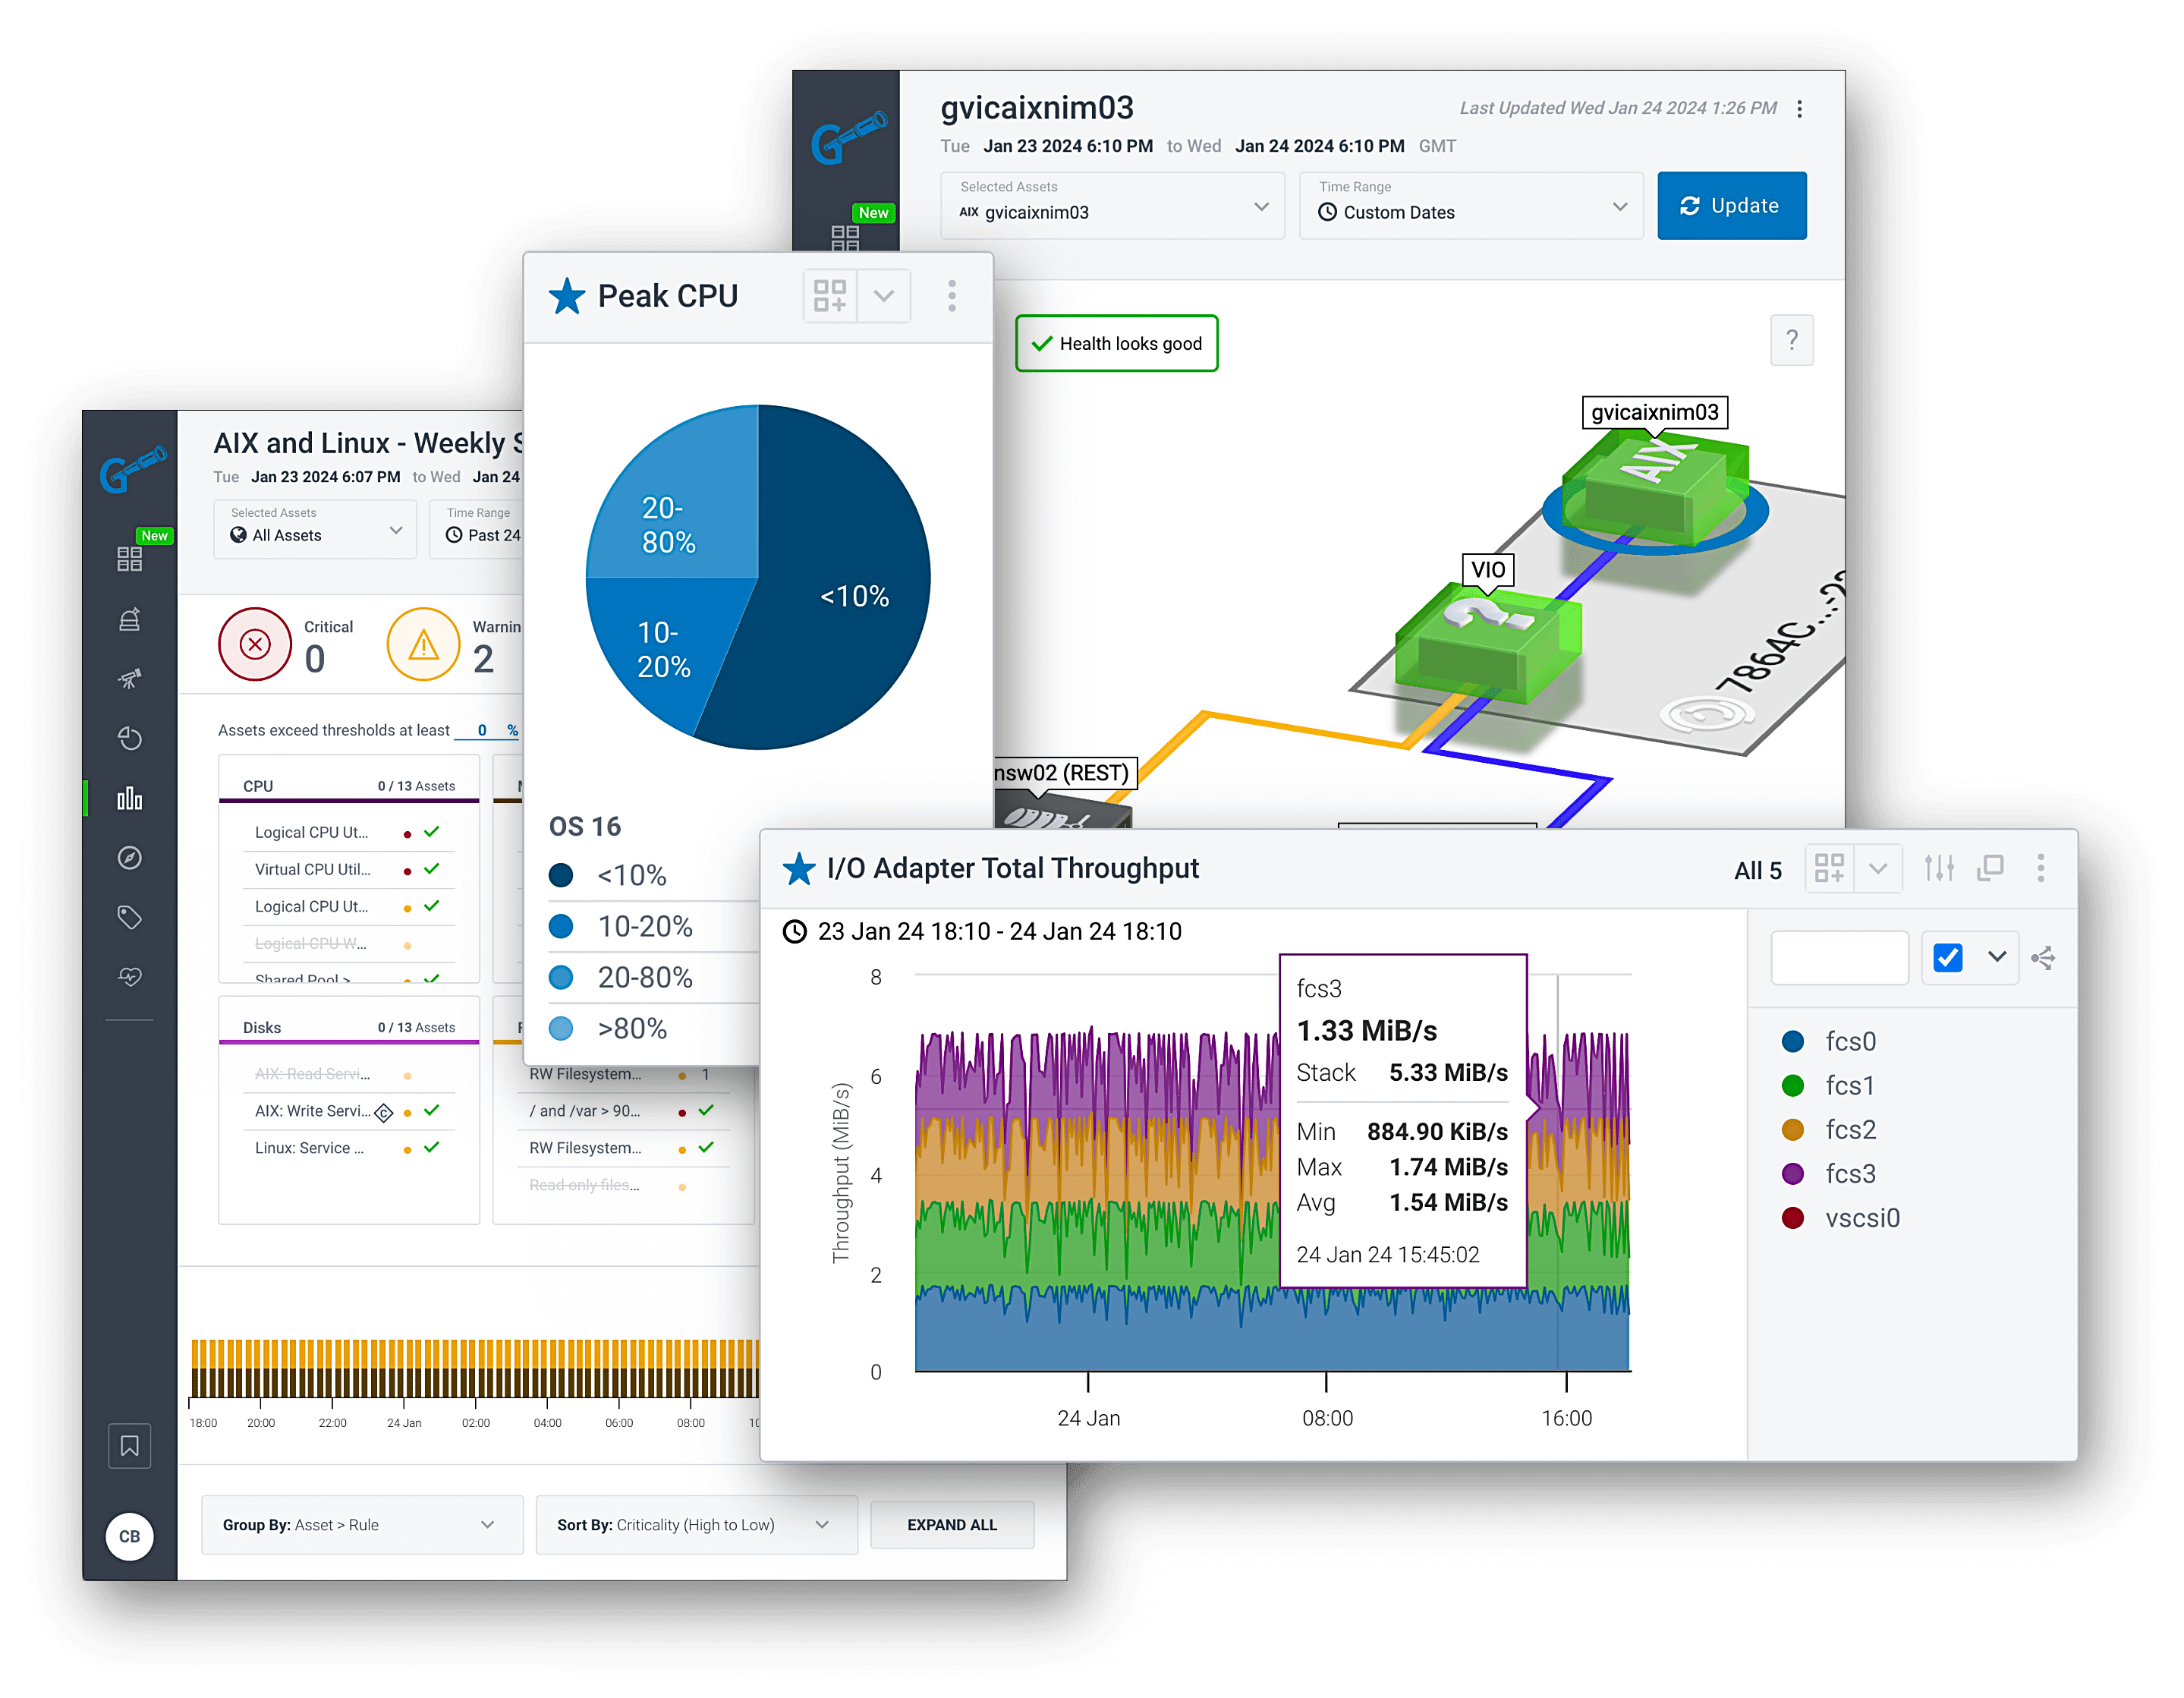
Galileo captures more IBM Systems performance data than any other platform, covering thousands of metrics across AIX, IBM i, and Storage. This depth of visibility allows IT teams to troubleshoot with precision, optimize workloads, and maintain peak performance.
AIX Monitoring
|
IBM i Monitoring
|
IBM Storage Monitoring
|
Faster, More Confident Decisions
Captures metrics others miss, enabling faster troubleshooting, more accurate performance validation, and confident capacity planning.
Clear Insight with Complete Context
Retains granular historical data without roll-ups or averages, empowering precise trend analysis and long-term infrastructure insight.
Efficiency Through Unified Visibility
Correlates AIX, IBM i, and Storage with other infrastructure technologies in one platform, integrating with tools like ServiceNow, Ansible, and others to streamline workflows and reduce manual effort.
Long-Term Clients
Reflects the measurable results, expert support, and lasting business value that keep 96% of our clients relying on Galileo year after year.
Built by IBM experts. Trusted by IT problem solvers.
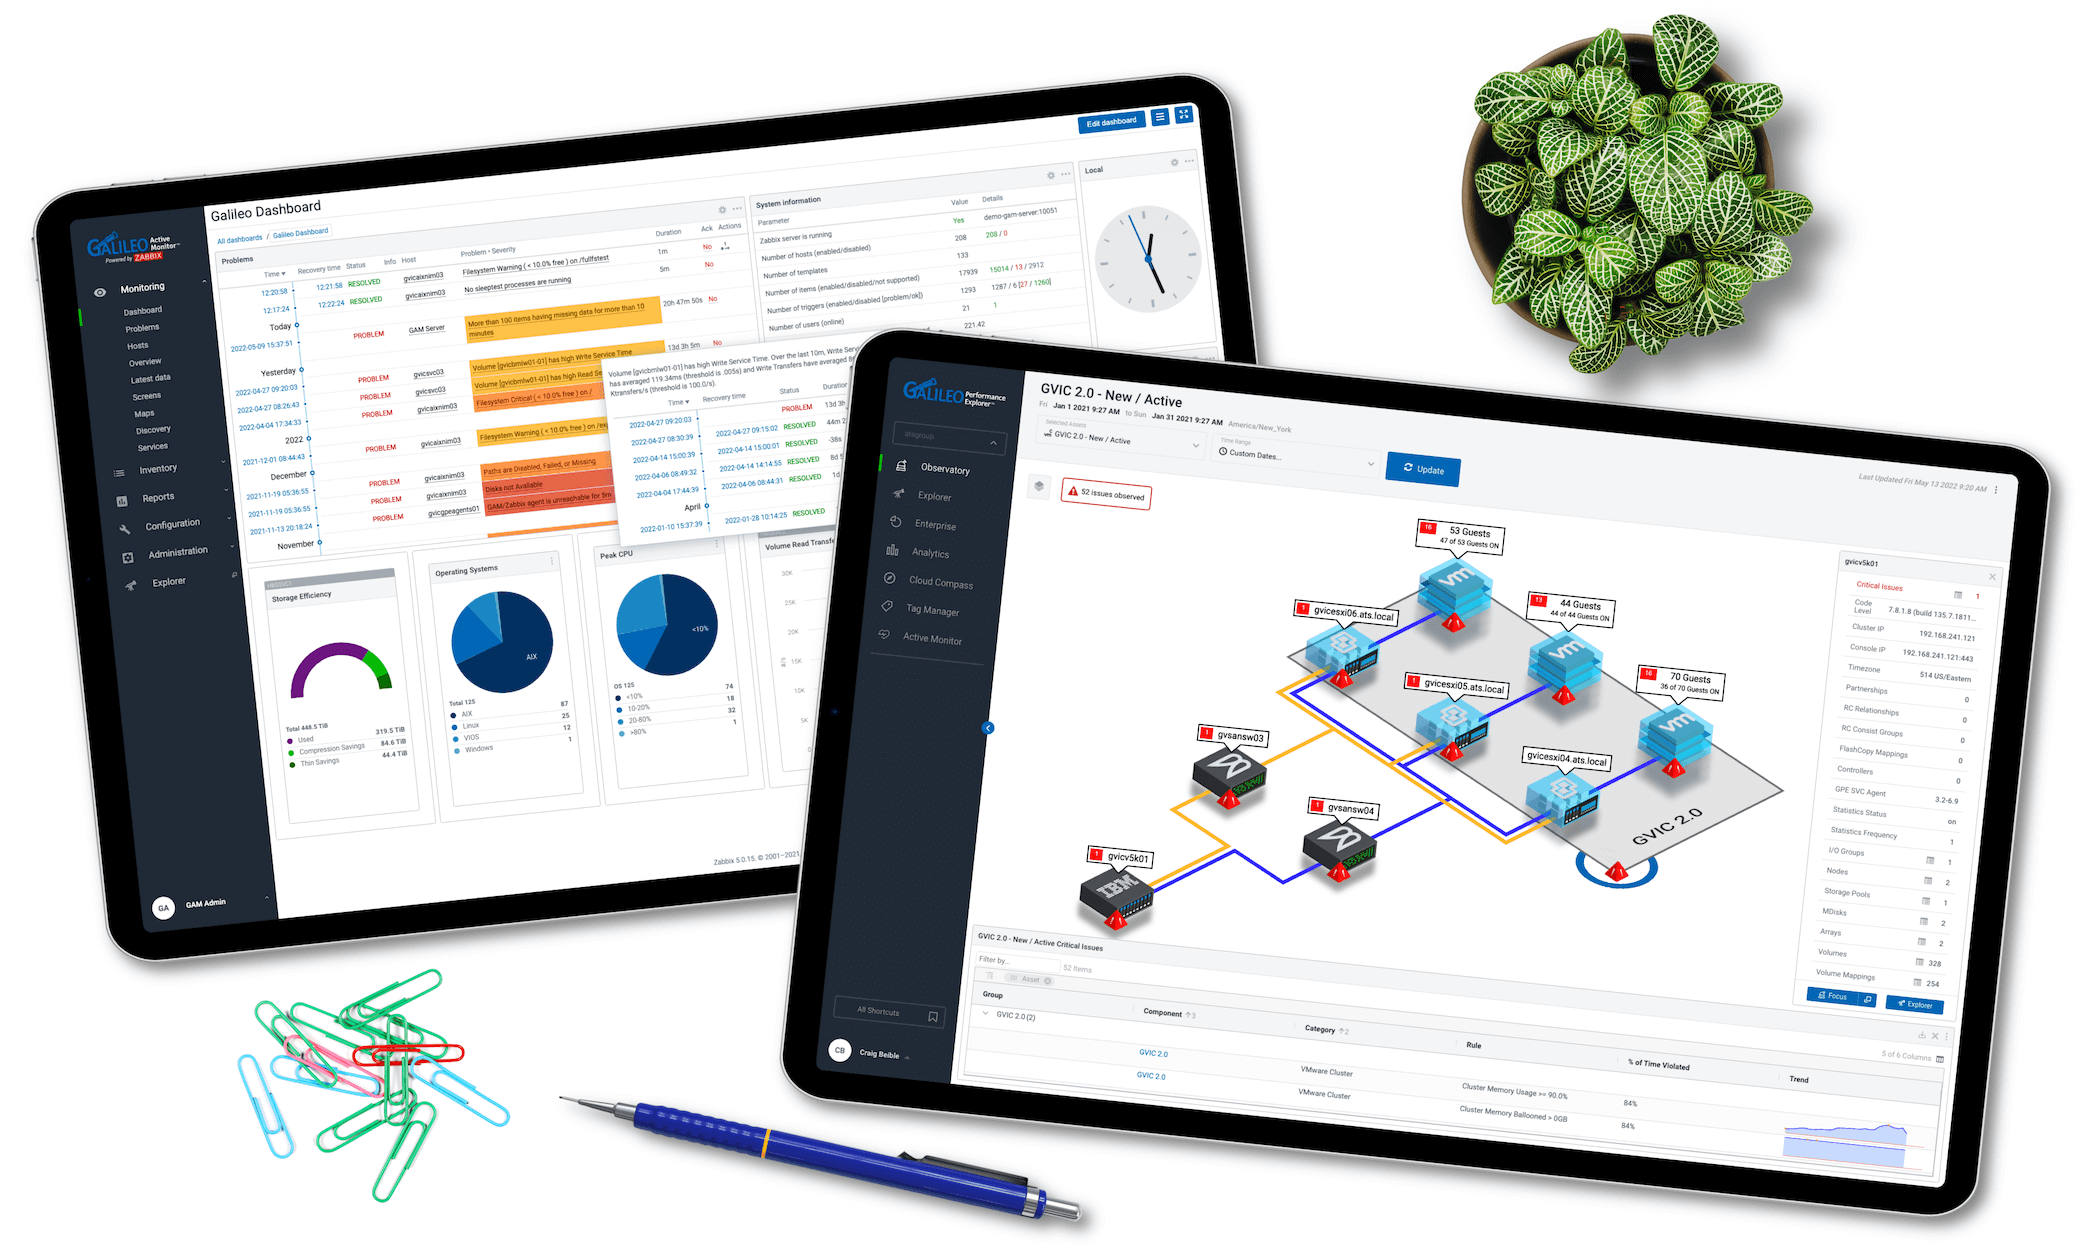
Every feature of Galileo translates into measurable value for IT and the business. From the depth of our data to the trust we’ve earned from clients, Galileo turns observability into operational advantage.
Praise From Galileo Clients
Our team is highly skilled in current and legacy technologies, solving what most providers can’t – or won’t. We help enterprise IT teams see what is relevant, anticipate and adapt to system changes, increase speed to resolution, and reduce operational costs. See what our clients have to say…
Sr. Systems Engineer
Hospital & Healthcare
We use Galileo to quickly determine the source of any issues, prevent outages, and predict future hardware and storage requirements for the critical patient care applications used by our nurses and doctors.
VP, Technical Resources
Managed Service Provider
Galileo is intuitive, easy to implement, and easy to navigate. The product keeps evolving and even allows us to look at EPIC environments, making it a one-stop shop for our team.
IT Director
Government Agency
Galileo is by far one of the best vendor teams I have seen in my career with a complete focus on the customer.
Cloud Engineer
Health Insurance Provider
With Galileo, I can see accurate measurements and trends to keep my hardware costs down.
Sr. Systems Engineer
Hospital & Healthcare
The data provided by Galileo also helps contribute to important revenue streams within the Health System.
Technical Program Director
Hospital & Healthcare
We use Galileo for real-time troubleshooting, performance management, and reporting. Galileo is also used by our governance teams to ensure our service providers meet our SLA and KPIs.
Cloud Engineer
Health Insurance Provider
The data provided by Galileo is far superior to what we are getting from Nutanix. Prism Central often reports that we are out of capacity, but Galileo consistently proves otherwise.
System Admin Manager
Financial Services
Galileo tells us if our environment is configured correctly in 5 seconds instead of 5 hours.
We’re proud to share that Galileo has earned a 4.9-star rating on Capterra!
See more Galileo user reviews on Capterra.com.
See everything. Solve ANYTHING.
Galileo’s IBM infrastructure monitoring expertise is reflected in every report, visualization, and automation insight we deliver.
Ready to see what meaningful observability looks like? Schedule a demo or start your free trial to experience Galileo’s depth, clarity, and simplicity firsthand.

See Galileo in Action!
Schedule a live demo tailored just for you.
See how Galileo delivers the data, visibility, and transparency you need.
Try Galileo FREE
Experience Galileo with your own data and see firsthand how it streamlines troubleshooting, forecasting, and planning.
