Infrastructure cost visibility has become a critical part of IT decision-making.
Performance still matters, but for many infrastructure leaders, that’s no longer the full conversation. Leadership teams increasingly want clarity around cost movement, upgrade exposure, underutilized resources, and whether infrastructure decisions are financially defensible.
That creates a different requirement for operations teams: visibility that connects technical behavior to business impact.
To support those conversations, we created a practical field guide focused on infrastructure KPIs that help teams evaluate cost efficiency, capacity risk, and operational performance.
What’s Included in the Guide
The guide outlines six practical metrics infrastructure teams can use to assess cost and performance more effectively:
- Infrastructure Utilization Rate
Identify overprovisioned compute, memory, and storage resources. - Stranded Capacity Cost
Quantify unused infrastructure in financial terms that leadership can understand. - Cost per Business Service
Connect infrastructure spend to business applications and services. - Software License Utilization
Surface over-licensed environments and renewal exposure. - Storage Dormancy Rate
Identify reclaimable storage tied to inactive data. - Infrastructure Cost Trend (12–24 Months)
Support proactive planning using actual infrastructure growth patterns.

The guide also highlights common operational gaps that make these metrics difficult to measure consistently, including fragmented visibility, limited historical data, and disconnected infrastructure insights.
Why This Matters
Defining KPIs is straightforward. Operationalizing them is where most teams struggle.
Without unified visibility across infrastructure domains, cost conversations often rely on fragmented tools, point-in-time reporting, or manual analysis. That makes it harder to explain cost changes, validate assumptions, or plan confidently.
For teams being asked to connect infrastructure performance with financial accountability, those gaps matter.
Download the Field Guide for Infrastructure Cost Visibility
Download the Galileo FinOps KPI Field Guide for IT Infrastructure to use as a practical reference for evaluating infrastructure cost, performance, and capacity decisions.
⬇️ DOWNLOAD PDF
Frequently Asked Questions About Infrastructure Cost Visibility
FinOps KPIs for IT infrastructure are operational and financial metrics used to help IT teams understand how infrastructure performance, capacity usage, and cost relate to one another.
Examples include utilization rates, stranded capacity cost, software license utilization, storage dormancy, and infrastructure cost trend projections. These metrics help organizations move beyond reactive cost discussions and make more informed infrastructure decisions.
Infrastructure cost visibility helps organizations understand where spending is increasing, where resources may be underutilized, and what financial risks may exist before upgrades or expansion decisions.
Without clear visibility, teams often rely on fragmented tools, manual reporting, or point-in-time snapshots that make cost conversations harder to defend.
Infrastructure teams use KPIs to identify inefficiencies, validate infrastructure assumptions, support capacity planning, and explain cost movement to leadership.
For example, low utilization rates may indicate overprovisioning, while software license utilization can reveal renewal exposure tied to unused entitlements.
Stranded capacity refers to provisioned infrastructure resources that are allocated but not meaningfully used.
This can include unused compute, idle storage, or licensed software capacity that exceeds actual demand. Over time, stranded capacity becomes a measurable source of avoidable infrastructure spend.
Many monitoring tools focus on alerts, snapshots, or isolated infrastructure domains.
That can make it difficult to connect performance behavior with cost trends, long-term capacity growth, or renewal planning. Supporting infrastructure cost accountability requires broader visibility, retained historical data, and the ability to correlate information across systems.
Observability helps infrastructure teams understand how systems behave over time, rather than relying only on isolated alerts or short-term reporting.
With better visibility into performance, utilization, and trends, teams can identify inefficiencies earlier, improve planning accuracy, and make more informed cost decisions.
Common KPIs include:
– Infrastructure utilization rate
– Stranded capacity cost
– Cost per business service
– Software license utilization
– Storage dormancy rate
– Infrastructure cost trend projections
The right mix depends on the organization’s infrastructure complexity, licensing exposure, and planning requirements.
See How Teams Measure These KPIs in Practice
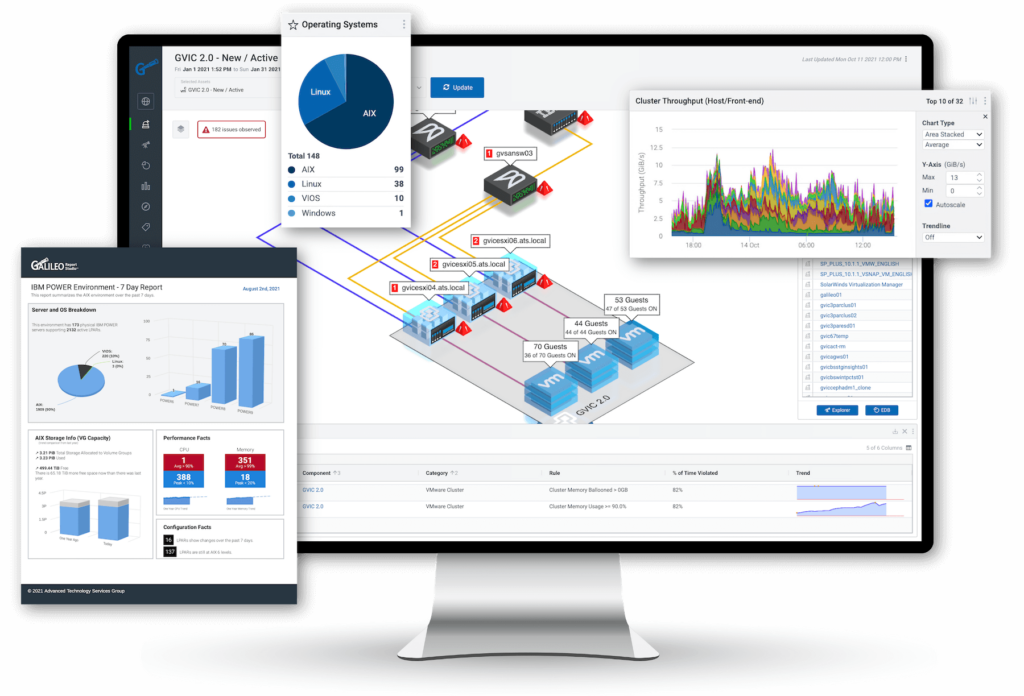
Galileo helps infrastructure teams bring performance, capacity, and cost-related visibility together in one place, making it easier to track these metrics across complex environments.
📆 Schedule a demo to see how Galileo delivers unified infrastructure visibility.