A Step-by-Step Guide to Sizing and Pricing your AWS or Azure Cloud Environment
In 2020, we started an internal project to price our data center systems to understand what they might cost to run in the AWS or Azure cloud environments.
We initially used some of the online pricing tools available from these vendors, but they were slow and difficult to use in bulk.
You can find the public cloud tools here: AWS and Azure.
Because of the nature of these tools, we were forced to add individual systems one at a time and pick options for each. That’s where we ran into our first obstacle.
What size systems do we choose?
Of course, we knew the size of our on-prem systems, but what should we select for the cloud? What if our existing systems are too big? For example, our application consisted of ten systems with 16 CPUs and 128 GB RAM each, but do they need to be that big? How do we know?
Why is Proper Sizing for the Cloud Important?
Because of virtualization via VMware or Nutanix, for example, most IT shops these days are not overly concerned with the number of vCPUs, memory, and the amount of storage their systems are configured with until they run low on physical resources. This is simply because they have already paid for these resources, and latent capacity is typically available. They will react if they notice resources becoming constrained, but it will not cost more on a month-to-month basis to leave it as-is, even if oversized.
Oversubscriptions on vCPUs are barely noticeable in an on-site virtual environment. Bloated memory configurations can be a little trickier but are usually managed well by the hypervisor. With thin provisioning, overprovisioned storage is less impactful.
Moving to the cloud is different. You pay for the instances and their size, and you pay for every GiB of storage you provision, so it better be sized correctly from the start.
If you oversubscribe locally in your VMware environment, it usually has no extra cost, but take that same system into AWS and buckle up. That first bill is going to be painful.
Accurately pricing a workload in AWS or Azure is arduous, but it’s not an impossible feat. In this article, I will show you how you can capture internal IT metrics on various systems, procure Azure and AWS pricing data in bulk, right-size your systems, and select the public cloud options that make sense for you.
How do you Size and Price Your Environment for AWS and Azure?
To right-size and obtain accurate pricing for your AWS or Azure cloud migration, you’ll need to do the following:
- Collect trustworthy (trend) usage metrics
- Obtain vendor pricing
- Right-size your systems
- Price your systems
How to Collect Infrastructure Usage Metrics for Cloud Sizing
Long-term metrics are the key to right-sizing your Linux and Windows systems. At a minimum, you’ll need the following:
- Current Configuration
- Number of CPUs
- Processor Speed
- Configured Memory (GiB)
- OS Type and Level
- Trend (5-minute (min) sample rate)
- CPU Used (%)
- CPU Used (#)
- CPU Demand (VMware)
- Active Memory
- Consumed Memory
- File Cache Memory
- Storage Capacity (Used and Total)
Collecting Linux Metrics
NMON is an excellent tool for gathering metrics on Linux instances.
Install the proper NMON build on your Linux system and run the following command to capture data to a file. This command captures 5-minute data points for 24 hours. (300 sec * 288 intervals = 86400 sec / 24 hours):
./nmon16m_x86_64_rhel8 -f -s 300 -c 288 -T
It will output a filename like the following.
760af2ea40b2_220330_0030.nmon
This file is a CSV with all the metrics listed above. Parsing through it is not very difficult, and the NMON analyzer tool is available to help with that. Remember, IBM owns Red Hat, so this tool is widely used and supported. It’s also free.
Collecting Windows Metrics
I’m not a strong MS Windows dev, so, truth be told, I don’t have a lot of input here. We didn’t have any window systems to migrate, so it wasn’t a big deal. I’m working on a go-lang WMI tool to capture what I need from WMI just for fun. That is available in this link, but it is a work in progress. Maybe you could add to it? It uses Go, which is surprisingly easy to use and pretty awesome. If you haven’t started playing with Go, you should try it. I was surprised by how easy it was to get these WMI stats in a compiled binary.
Windows WMI Capture Code Sample
Other tools exist, too. Perfmon, PowerShell, and native WMI are some valid Windows options. Galileo (my company) is great at this, too. It uses C++ and WMI for its Windows agent.
Collecting Virtual Machine Metrics
Virtual machine metrics are easier to gather in bulk (VMware, Nutanix). You can collect hundreds or even thousands of individual virtual system metrics in a single place, giving you the biggest bang for your data collection buck. I suspect most people would use this method since most of their systems are virtualized.
When collecting virtual machine metrics via the hypervisor, it’s important to remember that a utopian view of OS host metrics doesn’t exist (like those found in NMON). But when it comes to cloud pricing, you can still get what you need. Tools that interact with the OS have a much more detailed view of performance metrics and system configuration at the OS level than the hypervisor does. Today’s VM tools are better, but they are not full-blown collectors, so they can still be limited.
VMware
To collect trend data from VMware, connect to vCenter using the vSphere API to capture Virtual Machine CPU, memory, and storage statistics. Here is an example of how to do that using a simple ruby script.
vSphere API VMware Code Sample
Storing and Managing System Metrics
Gathering performance metrics is the easy part. Anyone can write a script. Although there are many (albeit frustrating) methods to collect the necessary metrics from various vendors and platforms, storing and accessing them over the long term is the real problem. Hundreds – even thousands – of metrics over many months is no picnic, and you can’t ignore accuracy on this point. If your collectors stop running during your most essential peaks, you will not be able to trust your sizing.
You will need substantial long-term data to best size your cloud instances. It is critical to measure the busiest times for your systems. That may only occur once every three months or once a year, but you will need all of it to be confident.
In the end, it’s much easier to rely on a tool like Galileo Performance Explorer to manage all of this automatically.

How to Obtain AWS or Azure Pricing in Bulk
Now, we get to the tough part. Holy cow, they make this difficult! I understand that what AWS and Azure do is extraordinarily complex, but WT%. Obtaining and understanding bulk pricing from AWS and Azure is dreadful, and there is no other way to put it.
The complete “menu” of options is staggering and overwhelming. It almost seems like it is intentionally complex. Here are a few:
- Locations – East or West
- Optimized Memory or CPU
- Number of CPUs
- Configured Memory
- Storage Options
- Operating System Costs
The list goes on. Put all of those together, and the choices are multiplied factors of each.
Nevertheless, you will need this list to determine pricing. So, what is involved in getting it?
- Create accounts on both AWS and Azure to access the info.
- Download the pricing files from each vendor.
That sounds easy, doesn’t it? But it’s a bit more complicated than that. Let me explain.
AWS Setup
The AWS pricing “card” is large and complicated but a well-constructed JSON. So, in our experience, it was a matter of understanding what we were looking at and writing our tool to do the repetitive work.
To access pricing in AWS:
- Ensure you have the AWS command line installed where you plan to run your scripts.
- Have your AWS administrator grant read access to the cost API.
Azure Setup
I thought the Azure pricing was going to be much more straightforward. The JSON file originally downloaded was very flat and seemed simple. However, this was NOT the case.
I used this Medium Article, How to query the Azure Rate Card API for cloud pricing (Thanks, Dan Maas). It does a decent job explaining the complexities and getting to the pricing card.
Side note: You’d think Azure would have this nailed, but nah, they left it to Dan. As a result, I grappled to understand how to use this data to price my systems. It wasn’t complete.
After following Dan’s article, I found an added pricing resource published by Azure. It was a newer pricing card and contained much clearer pricing terms than the original card shown in the Medium article. So, I thought I’d use that. This card did not have the capabilities attached to it, which means I had the prices, but I did not know the details of the systems, like CPU, memory, etc. In the end, I needed to merge the two, and it was awful.
My “Cloud Cost” Utility Tool
Luckily, I can share my experience with you. I built the following repo and provided it here to help you. It’s a Ruby gem/tool that can do all the heavy lifting to extract the vendor pricing data. It will produce two files: aws.json and azure.json.
The AWS file structure is untouched. It is how it comes from AWS.
The Azure file is restructured to resemble AWS. It takes the SKU file and the Pricing file from Azure and merges the capabilities and prices into a new structure.
Hopefully, you can get some use out of this. It’s not 100 percent complete because it only pulls CPU and Storage prices for one region, but if you dig into the code, you can probably find new ways to exploit it.
Access my “Cloud Cost” tool on Github.com
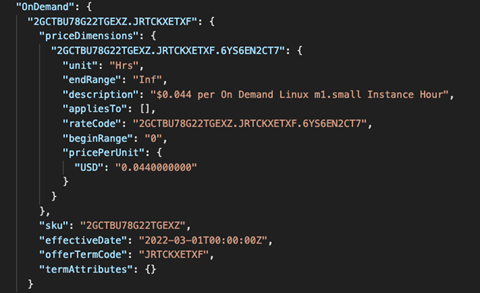
Here is an example of it running for AWS only. Azure would provide similar output.
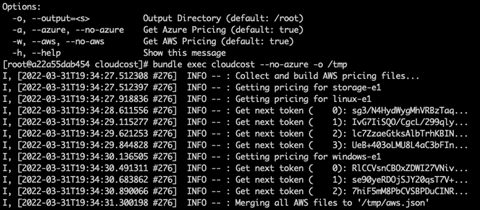
The file is an array of entries that follow this format:
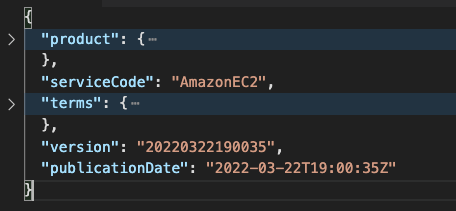
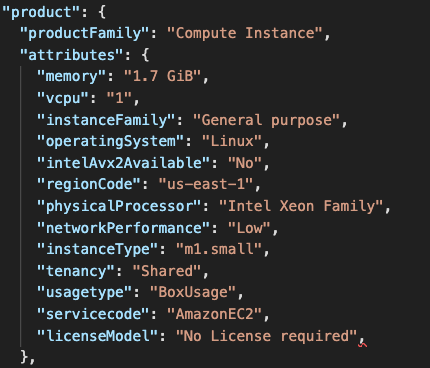
The product key holds the list of the “capabilities” to search through:
“Terms” refers to either OnDemand or Reserved options for pricing:
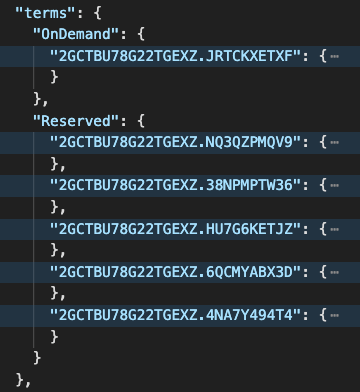
Each dimension lists the price point and the SKU.
How to Right-size Your Systems
Once you have the pricing data, right-sizing a system with accurate long-term metrics is more straightforward. You will only need to take the max used during your peak periods and add some headroom.
For example, let’s assume SYSTEM1 is configured with 4 CPUs, 8 GB RAM, and 500GiB storage.
The max CPU utilization of this system over the last year was 12%. The CPUs are 2.2GHz, and we have four configured. That’s 8.8 GHz available. At a 12% peak, that would only be 1.056 GHz, less than half a single CPU.
RAM would also be a consideration since the systems you would “lease” are tightly coupled by CPU and RAM.
In our SYSTEM1 example, we might find that we only use a peak of 15% actively used memory, which is 1.12 GB of RAM. So, we can also pare back this system’s memory to about 2GB or maybe 4GB, max.
Storage for SYSTEM1 is the same exercise. Use long-term trends to find the maximum total storage used and add some headroom for growth. Our max storage used was less than 20% over the year. With some room for growth, we only need about 125GB of what was assigned.
In the end, SYSTEM1 at 4 CPU, 8 GB RAM, and 500GB of storage should be 1 CPU, 4GB, and 125GB of storage when moved to the cloud.
Of course, we can and should add some headroom percentage to grow and be on the safe side.
You can see how performing this right-sizing exercise is critical before moving to the cloud. You can’t move SYSTEM1 as-is. It is a total waste of money. Right-sizing must be done.
Now it’s time to find the best price for SYSTEM1.
How-to Price Your (Right-sized) Systems
You can use any tool you’d like, but the goal is to supply the pricing data as a database for each system that must be priced. For example, you might want to use a simple algorithm to compare SYSTEM1 and its right-sized CPU and Memory to the least expensive, best-fit instance found in the pricing model.
Remember, you may not find a perfect “home” at Azure or AWS for SYSTEM1 at 1 CPU and 4GB. You may need to scale up to find something that would be available. AWS or Azure may not have a 1 CPU instance in the pricing terms we need. So, we walk the system “capabilities,” looking for the lowest CPU and RAM choices for this system. It’s a best-first-fit comparison.
Summary
So that’s it—a piece of cake. Right?
Except that this pricing exercise took us months! Of course, it’s possible, but the devil is in the details, and it’s a tedious and time-consuming job.
That’s why we developed a tool that takes care of all of this – it’s called Galileo Cloud Compass. With it, you can check different upfront costs and compare them to on-demand costs to see what options are suitable for you. Galileo uncovers it all very quickly.
However, we operate on a “value-first” approach. With the tools and process outlined in this article, you will be on your way to understanding how to adjust your systems and see what they might cost in the cloud. If you’d like some help and need to discuss your options, feel free to bounce ideas and questions off me. We’ll be with you every step of the way.